Download
1 / 32
330 likes | 609 Views
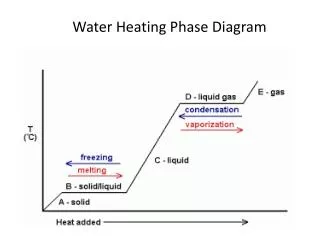
Phase Diagram. The state of matter of a substance is dependent on 2 variables. - Temperature - Pressure. You can use a Phase Diagram to determine the state of matter of a substance, depending on it’s temperature and pressure. Typical Phase Diagram. Important Parts of the Phase Diagram.

E N D
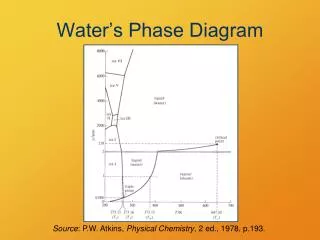
The state of matter of a substance is dependent on 2 variables.- Temperature- Pressure
You can use a Phase Diagram to determine the state of matter of a substance, depending on it’s temperature and pressure.
Melting Curve – shows the pressure and temperature that a solid becomes a liquid and visa versa.
Vapor Curve – shows the pressure and temperature that a liquid becomes a gas and visa versa.
Sublimation Curve – shows the pressure and temperature that a solid becomes a gas and visa versa.
Triple Point – is the temperature and pressure where all 3 phases of matter can coexist.
Critical Point – occurs under conditions at which no phase boundaries exist.
Phases Diagram for H2OAt 1 atm H2O melts at 0oC and boils at 100oC.
What state of matter would the following substance be under the following conditions?
What phase change would occur under the following conditions?
What state of matter would you have at a temp. of 200oC and a pressure of 0.50 atm?
What state of matter would you have at a temp. of 400oC and a pressure of 1.50 atm?
What state of matter would you have at a temp. of 100oC and a pressure of 2.0 atm?
What phase change would occur if the temp. was a constant 300oC and the pressure decreased from 1.25 to 0.5 atm?
What phase change would occur if the pressure was a constant 1.25 atm and the temp. increased from 0 to 800oC?
What temperature and pressure can all 3 phases exist at once?
Use the information you just got to complete the ‘Phase Diagram Practice Sheet 1213’ .Due tomorrow (10 pts.)Individual Work!!
Once finished with the worksheet:- Complete the Gizmo worksheet and quiz- Complete the Kinetic Theory and Endo/Exo. Practice Sheet and put it in the appropriate dropbox.