Download
1 / 27
270 likes | 476 Views
Phase Diagram. Module III. Introduction. Limitation of pure metals Need of alloying. Solid Solution. Metals generally form homogeneous liquid state

E N D
Phase Diagram Module III
Introduction • Limitation of pure metals • Need of alloying
Solid Solution • Metals generally form homogeneous liquid state • Even after their transformation in to a solid crystalline state, the metal remain their homogeneity and consequently their solubility, a solid solution is said to have formed. • A solid solution is simply a solution in the solid state and consist of two kind of atoms combined in one type of space lattice. • Brass is a solid solution of Copper (64%) and Zinc (36%)
Types of solid solution • Substitutional solid solution • Disordered • Ordered • Interstitial solid solution
Hume Rothery’s Rule (or factors governing Substitutional solubility) • Crystal structure factor • The crystal lattice structure of two element should be same • Relative size factor • The two metal’s atomic diameter shall be fairly similar • Chemical affinity factor _The difference in electro negativity should be small • Relative valence (valency) factor _The valency of atom must be nearly same
Why Study Phase Diagrams? • One reason that a knowledge and understanding of phase diagrams is important to the engineer relates to the design and control of heat treating procedures; • Even though most phase diagrams represent stable (or equilibrium) states and microstructures, they are nevertheless useful in understanding the development and preservation of non equilibrium structures and their attendant properties;
Introduction • The understanding of phase diagrams for alloy systems is extremely important because there is a strong correlation between microstructure and mechanical properties, and the development of microstructure of an alloy is related to the characteristics of its phase diagram. In addition, phase diagrams provide valuable information about melting, casting, crystallization, and other phenomena.
Definitions and Basic Concepts • Component- components are pure metals and/or compounds of which an alloy is composed. • System- which has two meanings. First, system may refer to a specific body of material under consideration (e.g., a ladle of molten steel). Or it may relate to the series of possible alloys consisting of the same components, but without regard to alloy composition (e.g., the iron–carbon system).
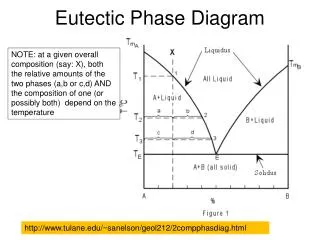
Definitions and Basic Concepts Solubility Limit • For many alloy systems and at some specific temperature, there is a maximum concentration of solute atoms that may dissolve in the solvent to form a solid solution; this is called a solubility limit.
Phase • A phase may be defined as a homogeneous portion of a system that has uniform physical and chemical characteristics. • A phase is a physically distinct, chemically homogeneous, mechanically separable region of a system.
Phase Diagram • Much of the information about the control of the phase structure of a particular system is conveniently and concisely displayed in what is called a phase diagram, also often termed an equilibrium diagram. • There are three externally controllable parameters that will affect phase structure—temperature, pressure, and composition • Phase diagrams are constructed when various combinations of these parameters are plotted against one another
Unary Phase Diagram • Perhaps the simplest and easiest type of phase diagram to understand is that for a one-component system, in which composition is held constant • This one-component phase diagram (or unary phase diagram) [sometimes also called a pressure–temperature (or P–T) diagram] is represented as a two-dimensional plot of pressure versus temperature
Binary Phase Diagrams • Another type of extremely common phase diagram is one in which temperature and composition are variable parameters, and pressure is held constant—normally 1 atm. • There are several different varieties; in the present discussion, we will concern ourselves with binary alloys—those that contain two components. • If more than two components are present, phase diagrams become extremely complicated and difficult to represent
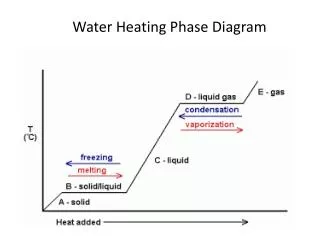
Binary Phase Diagrams • Binary phase diagrams are maps that represent the relationships between temperature and the compositions and quantities of phases at equilibrium, which influence the microstructure of an alloy. • Many microstructures develop from phase transformations, the changes that occur when the temperature is altered (ordinarily upon cooling). • Binary phase diagrams are helpful in predicting phase transformations and the resulting microstructures, which may have equilibrium or non equilibrium character.
Binary Phase Diagrams • Construction
Binary Isomorphous Systems • Possibly the easiest type of binary phase diagram to understand and interpret is the type that is characterized by the copper–nickel system • Three different phase regions, or fields, appear on the diagram, an alpha (α) field, a liquid (L) field, and a two- phase (α+L) field. • The copper–nickel system is termed Isomorphous because of this complete liquid and solid solubility of the two components.
Interpretation Of Phase Diagrams • For a binary system of known composition and temperature that is at equilibrium, at least three kinds of information are available: (1) The phases that are present (2) The compositions of these phases (3) The percentages or fractions of the phases.
Phases Present • The establishment of what phases are present is relatively simple. One just locates the temperature–composition point on the diagram and notes the phase(s) with which the corresponding phase field is labeled.
Determination of Phase Compositions • The first step in the determination of phase compositions is to locate the temperature–composition point on the phase diagram. • Different methods are used for single- and two-phase regions. If only one phase is present, the procedure is trivial: the composition of this phase is simply the same as the overall composition of the alloy. • For an alloy having composition and temperature located in a two-phase region, the situation is more complicated.
Determination of Phase Compositions • To compute the equilibrium concentrations of the two phases, the following procedure is used: 1. A tie line is constructed across the two-phase region at the temperature of the alloy. 2. The intersections of the tie line and the phase boundaries on either side are noted. 3. Perpendiculars are dropped from these intersections to the horizontal composition axis, from which the composition of each of the respective phases is read
Lever Rule • For the arm to be horizontal, the weight to be hung at each end must be proportional to the arm length on each side of the fulcrum.
Determination of Phase Amounts • WL= S X100% R+S • Wα = S X100% R+S • WL= Cα-CO X100% Cα-CL • Wα= CO-CL X100% Cα-CL