Download
1 / 58
590 likes | 731 Views
Distribution of total and sample mean. Sample Statistics & Data display. We can calculate statistics form a sample. These reflect what is happening in the population as a whole. The statistics in the sample reflect the parameters in the population. Example.

E N D
Sample Statistics & Data display • We can calculate statistics form a sample. • These reflect what is happening in the population as a whole. • The statistics in the sample reflect the parameters in the population
Example 25 people in a lift. They have a mean weight of 65kg and a SD of 7kg. Find the mean and SD of the load
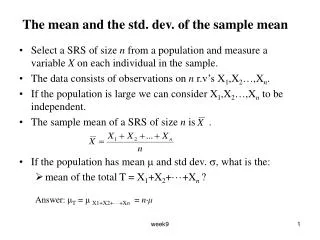
If we repeat an experiment a certain number of times, then T is the sum of n independent random variables.
A fruit and vegetable market accepts deliveries of crates of apples. Each crate has a weight that is normally distributed with a mean of 21kg and a standard deviation of 0.4 kg. The crates are delivered in groups of 18 on pallets that weigh exactly 30kg. • Calculate the mean total weight of a pallet with 18 crates of apples • Calculate the standard deviation of the total weight of a pallet with 18 crates of apples.
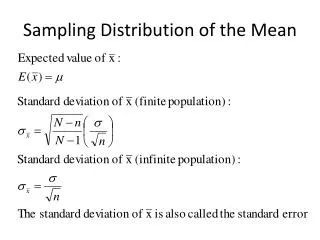
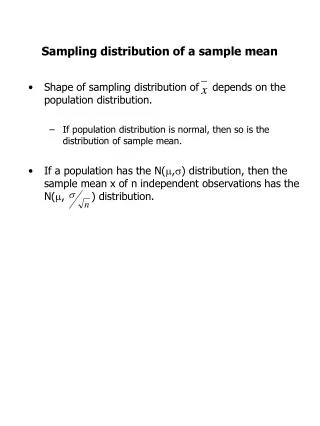
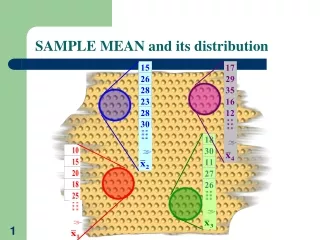
Central Limit Theorem Consider a sample size n from a population X with a mean of µ and a SD of σ sample mean=µ Sample standard deviation s = Variance s2= σ2 n If n is large (>30) then the distribution of the sample means will be approximately a normal distribution The Central Limit Theorem states that values of the sample means could be expected to average out to the population mean. There is a certain amount of spread about the mean. This is the standard error or standard deviation of the sample mean
Example A sample of size 20 is taken from a box of beans. The mean length of the beans in the box is 19 cm with a SD of 2.5cm. a) What would the expected value of the sample be? b) What would the variance of the sample be? c) What would the standard error of the sample be?
We need to know the difference between the mean, variance and standard deviation, of the population, total of n values and the sample Summary Table from p. 182
Probabilities for the total When we deal with the sum of a few variables We use: the sum will be within a certain given range The distribution of the sum is normal, it will be shaped like the bell curve The probability is the area under the curve
Example A sample of 16 items is taken from a population X with a mean µ=34, and a SD σ=4 Calculate the probability that the total T of 16 items is below 530 530 544 • Lower: -1Exp99 • Upper: 530 • = 16 • = 544
Example A lift is licensed to carry a maximum of 25 passengers. It is overloaded when the total passenger loads exceeds 1700kg. The weight of single passengers chosen at random have a mean of 65kg and a standard deviation of 7kg. Calculate the probability that the lift is overloaded, assuming the lift is carrying 25 passengers.
Probabilities for the sample mean Sometimes we need to know the probability of where the sample mean is likely to be in relation to the population mean. The sample mean is likely to have a smaller spread as the standard deviation will be smaller For this we use:
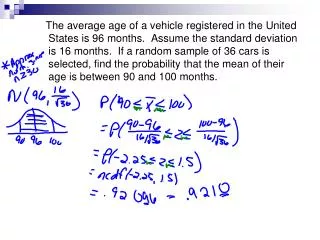
Probability for samples A sample size of 36 is taken from a normally distributed population with a mean of 40 and a standard deviation of 12. Calculate the probability that the sample mean is • Less then 41 • Between 37 and 42
Confidence Intervals • Remember we calculate statisticsfrom a sample toestimate the parameters of the population • Each sample mean will be slightly different for every other sample mean, so it is better to give an interval that we will be confident that the sample mean is within. This is our degree of confidence. • The spread of the values that the sample means take gives an idea of how accurate the estimate is. This is called the confidence interval. • The spread on either side of the mean, the standard deviation of the mean is called the standard error
Using the calculator to find confidence intervals Construct a 95% confidence interval, given n=25, µ=28.3, σ=4.38 For the calculator Confidence interval between these boundaries Calculator only measures from the far left We can use the calculator to find Z the number of SDs
Calculating the Sample Size If we want to have a certain confidence level that the sample mean of a sample we are going to take, will lie with in given boundaries. The margin of error is the distance between one of the end points of the interval and the sample mean Margin of error e Margin of error e e=z × e=z × µ Eg For 30m<µ<34m, the confidence interval is 32±2m The margin of error is 2m
A certain make of scientific calculator is known to have a voltage rating with a standard deviation of 0.05v. The mean voltage of 40 of these calculators is 3.02V. • Construct a 90% confidence interval for the average voltage. • Explain the meaning of this confidence interval
Construct a 95% confidence interval, given n=25, µ=28.3, σ=4.38 From the calculator Confidence interval between these values
Using the Calculator to check your answer Eg #1 Ex14.1 Construct a 95% confidence interval, given n=25, µ=28.3, σ=4.38
WB Eg 11 • The time taken for an individual to walk to work is to be estimated. On 15 occasions the time in minutes were, 18, 17, 15, 20, 16, 14, 19, 13, 17, 16, 14, 15, 20, 18, 19 • Find the sample mean and SD • Assuming normal distribution and that the sample is sufficiently large, calculate a 95% confidence interval for the mean time to walk to work. • Use the calculator to answer a) 95% 0.475+0.5 =0.975 Z=1.96 0.475
Interpreting Confidence Intervals There is a 95% probability that the interval 15.6-17.8 contains the true mean.
Confidence Intervals for Proportions Another parameter of the population is the population proportion p or π. This is the probabilityof success over a large number of trials, which should be similar to the proportion of successes in the population as a whole The best estimate of the proportion of success for the population is the sample X, the random variable for the number of successes in the sample has a approximately a normal distribution.
Example A random sample of 80 households showed that 30% owned PCs. Construct a 95% confidence interval for p, the percentage of households that own a PC There is a 95% probability that the interval 19.96%-40.04% contains the true population proportion. (There is 95% probability that the interval 19.96%-40.04% contains the proportion of households that own PCs.)
In a sample of 210 people with high blood pressure a particular drug is found to be effective for 150 of them. Construct a 95% confidence interval for P the proportion of all patients who use this particular drug for high blood pressure
The main purpose of a recent survey was to estimate the proportion of all adult NZers who are opposed to tipping for service in restaurants. The survey used a random sample of 663 adult New Zealanders, of whom 292 indicated that they are opposed to tipping for service. • State clearly the parameter of interest in this survey (A) • Calculate a 90% confidence interval for the proportion of all adult NZers who oppose tipping.(A) • Analyse the effect of increasing the number of adults surveyed on the width of this confidence interval. (E) d) Suppose 50 independent random samples of adult NZers are taken and 90% confidence interval is constructed from the results of each sample. Analyse the phrase “90% confidence" by making reference to these 50 confidence intervals. (E) There is 90% probability that the true population proportion lies within the confidence Interval of any one of the 50 random samples. That is 45 out of 50 confidence intervals contains the true population proportion.
Motel occupancy rates for July 1997 from a random sample of 35 motels gave the following statistics: • Sample size 35 • Sample mean 0.572 • Sample standard deviation:0.065 1) Calculate a 95% confidence interval for the mean occupancy rate for July 1997 for the population sampled. (A) 2) What would be the effect of increasing the level of confidence on the width of this confidence interval? (M) 3) The mean occupancy rate for the same population for July 1996 is 0.585. It is claimed that the mean occupancy rate for July 1997 is the same as the mean occupancy rate for July 1996. Using the confidence interval calculated in (a) at the 95% level of confidence, demonstrate whether the random sample gives us evidence against this claim. (M) 4) Calculate the number of motels needed to be sampled if the mean occupancy rate for July 1997 was to have been estimated to within 0.015 of its true value at the 95% level of confidence. (M)
Confidence interval for the difference between two means If two populations are the similar then we would expect the difference between their two means to be about zero. If the populations are different then we would expect the means to be different. So if two populations are different, the confidence interval of the difference between their means must not contain 0.
Example • A random sample of 30 objects is taken from a normally distributed population with a SD of 6, another sample of 50 objects is taken from a population with a SD of 8. The mean of the first sample is 115, and that of the second is 108. • Construct a 96% confidence interval for µ1- µ2. • Explain whether its likely that the two groups have the same mean. Is the 96% confidence interval for the difference between the two means. The interval does not contain 0, so it is not likely that the two means are equal. We can say this with at least 96% confidence.
Students are told to measure the area of the classroom, they provide estimates which are approximately normally distributed with SD=0.15m2. 31 students measured one classroom obtained a mean of 29.76m2 , while 26 students measured another classroom and obtained a mean of 31.23m2. What is the 95% confidence interval for the amount by which the area of the second classroom exceeds that of the first. This is the 95% confidence interval for the amount by which the area of the second classroom exceeds that of the first. We are 95% confident that the area of the second exceeds that of the first as zero is not in the confidence interval
Interpretation If the confidence interval includes zero then we cannot say that there is a difference between the two samples If zero is not included then we are confident that there is a difference between the two samples We need to make the assumptions that the samples are large enough and that they are independently selected and that the population they are selected from is normally distributed
a< μ2– μ1 <b • If both a and b are positive, it is reasonable to assume that μ2 is larger than μ1 by between a and b units. It’s unlikely two means are the same. • If both a and b are negative, it is reasonable to assume that μ2 is smaller than μ1 by between -a and -b units. It’s unlikely two means are the same. • If a and b have opposite signs, it is reasonable to assume that μ2 is smaller than μ1 by –a or μ2 is larger than μ1 by b units or somewhere in between. This includes the possibility that the two means are equal.
True or false A 99% confidence interval for the difference between two means is calculated from sample data. -3.5< μ2– μ1 <9.4. • There is a 99% probability that the means are equal because the interval includes 0. • 99% of intervals calculated in the same way will include the difference of the two means.
Below is a random sample of times for both male and female competitors to complete the annual Mountain Biking Race. • Calculate a 95% confidence interval for the difference between the mean time for males to complete the race and the mean time for females to complete the race. • In last year’s race, a similar 95% confidence interval for the difference between µmand µf was calculated and found to be -6.25< µm - µf <1.36. Based on this confidence interval, demonstrate whether there is a significant difference between the mean race times for males and females. 0 is in the 95% interval (-6.25< µm - µf <1.36) so it can be concluded that there is no significant difference between the mean race time for males and females.
Below is the summary stats for the length of the snapper surveyed in each region are shown in the table below. a) Calculate a 95% confidence interval for the difference between the mean length of snapper in the reserve and the non-reserve regions. b) It is claimed that the ‘average snapper’ in the reserve is at least 130mm longer than the “average snapper” in the non-reserve region. Use the 95% confidence interval from a to analyse the validity of this claim. 95% of the confidence interval between 85.03 and 121.15 contains the difference between the non-reserve and reserve snappar. 130 mm is not in this interval and so one can be 95% sure that this claim is invalid.
Interpretation of Confidence Intervals The company produces two different models of batteries. ‘power’ and ‘super’. 95 people were interviewed who have used both ‘power’ and ‘super’ batteries, to find out which of the two models these people prefer to use in their torches. Of the 95 people, 63 said that they prefer to use the ‘power’ model in their torches. a) Find a 95% confidence interval for the proportion of all people who have used both ‘power’ and ‘super’ batteries and prefer to use the ‘power’ model of battery in their torches. 0.568<π<0.758 b) Write a clear description that gives the meaning of this confidence interval. 95% of the confidence intervals from 0.568 and 0.758 contain the true proportion of people who prefer the ‘power’ model.
If we are given a particular level of confidence we can calculate the sample size (n) to give the required margin of error (e) 95% confidence interval, σ=4, margin of error e=2 How big is the sample size? e=z × 95% 0.975 for calc Z=1.96 0.475
A random variable is known to have a standard deviation of 14. What sample size would be required to be 90% confident that an estimate of the mean was within 2 units of its true value 0.95 for the calc 0.45 e=z ×
Calculate sample sizefor proportion A pilot survey from a few tax returns has shown that approximately 12% of all taxpayers are in ‘high-income’ category. If the Inland Revenue Department wishes to estimate this percentage to within 1%, with 96% confidence, how many tax returns should it sample?
Calculating sample size for proportion A market research company wishes to estimate the percentage of people in a certain age bracket who read a current-affairs magazine. The degree of confidence required for this estimate is 90%. What sample size should be taken to estimate the percentage to within 4%. For Calculator It is easier to rearrange the formula first p
Calculating Sample Size What size of sample should be taken from a population of packets of butter, when the standard deviation of the weights of packets is 4 g, if the mean weight is to be estimated to within 0.5 g with 95% accuracy. σ z • Use inverse norm • to find out Z value • σ=1 μ=0 2) n= e
Sample size for population proportion Radio Sport wishes to conduct an opinion poll on whether the captain of the New Zealand netball team should be replaced. The degree of confidence required for this poll is 95%. What size sample should be used to obtain the percentage to within 5% accuracy? • Use inverse norm • to find out Z value • σ=1 μ=0 pq z2 2) n= e2
Sample size for proportion and sample mean • An opinion poll with a level of confidence of 95% and an estimated value of p of 0.5 has a margin of error of 4%. How many people would have taken part in the poll? • A sample of containers of car parts has a mean weight of 40kg and a standard deviation of 5 kg. How many containers would need to have been in the sample to ensure at the 95% level of confidence that the sample was within 0.5kg of the population?