Download
1 / 27
330 likes | 987 Views
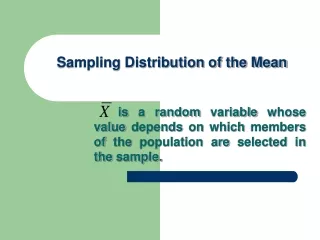
Sampling Distribution of the Mean. Sampling Distribution of the Mean. It is not necessary to use the finite population correction factor even when the population is finite if the sample size is less than or equal to 5% of the population (n/N < .05). Properties of the Standard Error.

E N D
Sampling Distribution of the Mean It is not necessary to use the finite population correction factor even when the population is finite if the sample size is less than or equal to 5% of the population (n/N < .05)
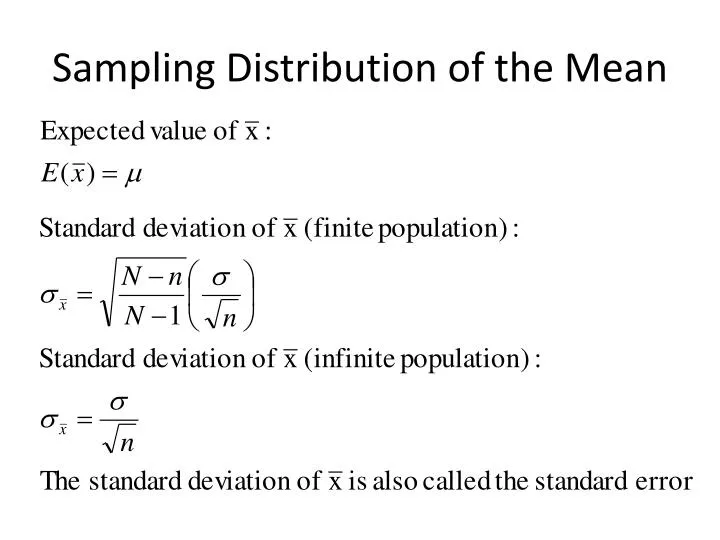
Properties of the Standard Error • The greater the dispersion in the variable the larger the standard error • The larger the sample size the smaller the standard error • The size of the standard error decreases at a decreasing rate as observations are added • Assume s = 100: • nStandard errorD • 500 4.5 • 1,000 3.2 -1.3 • 1,500 2.6 -0.6 • 2,000 2.2 -0.4
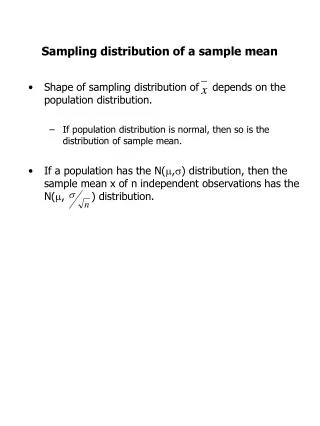
Shape of the Sampling Distribution of the Mean If the variable has a normal distribution the sampling distribution will have a normal distribution
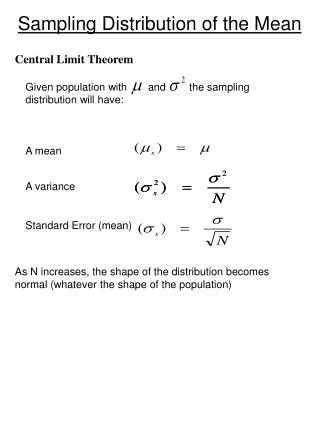
Shape of the Sampling Distribution of the Mean If the variable does not have a normal distribution the Central Limit Theorem applies. Central Limit Theorem In selecting simple random samples of size n from a population, the sampling distribution of the sample mean can be approximated by a normal distribution as the sample size becomes large (typically n > 30).
Central Limit Theorem http://onlinestatbook.com/stat_sim/sampling_dist/index.html See page 273
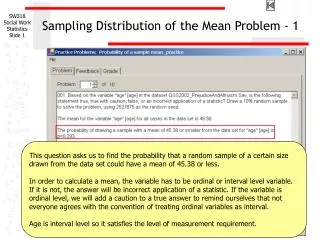
Sampling Distribution of the Mean, Example A beverage bottler must be confident that a 12-ounce bottle actually contains at least 12 ounces. If a machine is set to fill the bottles with 12.1 ounces and the standard deviation is 0.6 ounces, what is the probability that a sample of 36 bottles would have a mean less than 12?
Sampling Distribution of the Mean, Example Assume a firm has 500 employees. On average, the employees drink 3 cups of coffee per day. The standard deviation for coffee consumption is 2. If a sample of 100 workers is drawn, what is the probability that the average consumption for the sample will be above 3.4 cups?
Sampling Distribution of a Proportion The sampling distribution of a proportion is really a binomial experiment. For example, if we draw a sample of 500 people and ask what is the probability that more than 50% will support health care reform, that is equivalent to asking what is the probability of getting 250 or more “successes” from 500 trials.
Sampling Distribution of a Proportion Again, we can use the normal distribution to approximate the binomial distribution if: np> 5 and n(1-p) > 5
Sample Proportion Example The probability a machine will produce a bad part is 5%. Assume a sample of 100 parts is drawn. What is the probability the sample value will differ from the population value by more than 1%?
Sample Proportion Example • Step 1: Find the standard error • Step 2: Find z scores • z1 = (.04 – .05)/0.022 = -0.45 • z2 = (.06 – .05)/0.022 = 0.45 • Step 3: Find the corresponding value in the standard normal table • P(z < -.45 or z > .45) = .3264 + .3264 = .6528
Sample Proportion Example Again, the probability a machine will produce a bad part is 5% and a sample of 100 parts is drawn. What is the probability the share of bad parts in the sample will exceed 7%?
Sample Proportion Example • Step 1: Find the standard error • Step 2: Find the z score • z = (.07 – .05)/0.022 = 0.91 • Step 3: Find corresponding value in standard normal table • P(z > .91) = .1814
Properties of Point Estimators • Unbiasedness • Efficiency • Consistency
Unbiased When the expected value of the point estimator is equal to the value of the parameter. For example:
Efficiency An estimator is more efficient than another estimator if it has a smaller standard error. The sample mean is more efficient than the sample median. http://onlinestatbook.com/stat_sim/sampling_dist/index.html
Consistency As the sample size is increased the values of the point estimator become more tightly bunched around the parameter.
Other Random Sampling Methods • Stratified random sampling • Cluster sampling • Systematic sampling
Stratified Random Sampling The population is divided into groups (strata) and observations are randomly selected from each strata.
Cluster Sampling The population is divided into groups (clusters), and then clusters are randomly selected. Observations are then randomly selected from the selected clusters.
Other Sampling Methods • Convenience sampling – select the most convenient observations to sample • Judgment sampling – observations are chosen based on the researcher’s judgment of who is representative of the population
Graded Homework P. 246, #31 P. 279, #29 P. 284, #39