Download
1 / 17
180 likes | 304 Views
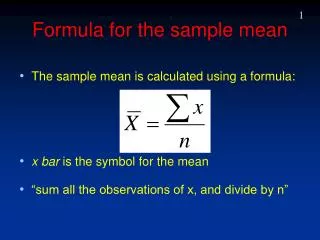
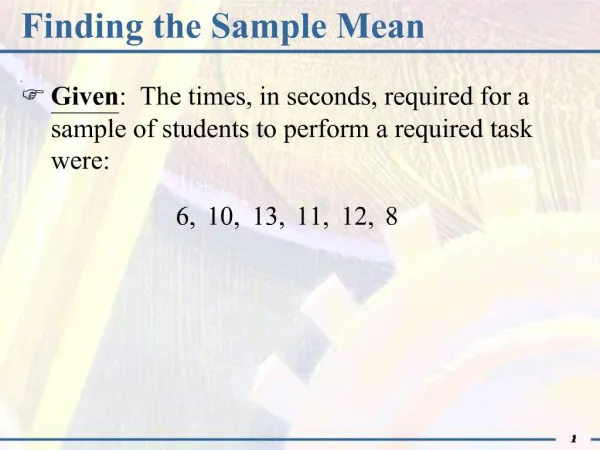
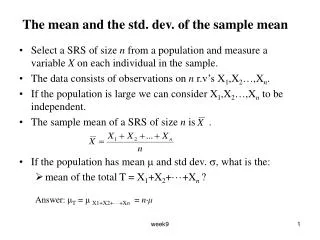
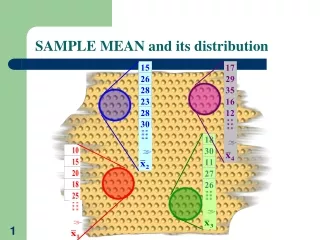
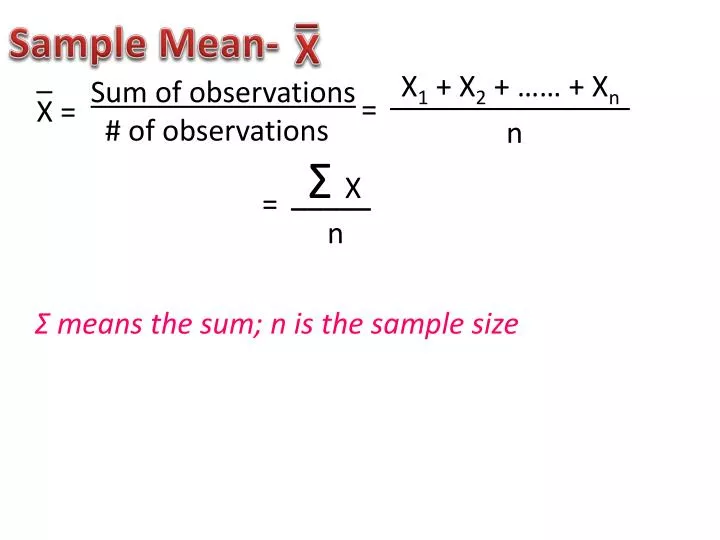
_. Sample Mean-. X. _. X 1 + X 2 + …… + X n. Sum of observations # of observations. _______________ n. =. X =. Σ X. _____ n. =. Σ means the sum; n is the sample size. -The mean is sensitive to the influence of extreme observations.

E N D
_ Sample Mean- X _ X1 + X2 + …… + Xn Sum of observations # of observations _______________ n = X = ΣX _____ n = Σ means the sum; n is the sample size
-The mean is sensitive to the influence of extreme observations -The mean describes, how large each observation in the data set would be if the total were split equally among all observations -EX: If $120 were given to a group of 10 teenagers they would have an average of $12 per person ($120 divided equally among the 10 of them)
M Median- -midpoint of a distribution, such that half of the observations are smaller and half are larger Finding Median 1. Arrange data from smallest to largest 2. n + 1 to find position of the median 2
Comparing the Mean and Median -exactly symmetric distribution: X and M are equal _ -in a roughly symmetric distribution: X and M are close _ -Skewed distribution: X usually farther out in tail than median _
Center: Mean or Median? -a skewed graph or one with outliers will effect the mean but not the median EX: In Major League Baseball most players make close to the minimum salary ($400,000 in 2009) but some earn more than $10 million. The median salary for MLB players in 2009 was about $1.15 million. The mean salary was over $3.24.
A useful numerical description of a distribution requires both center and spread. Simplest measure of spread range Range depends only on min and max which could be outliers. We can improve our description of spread by also looking at the spread of the middle half.
Another way to find center/spread -Order all of the data from least to greatest and find the median Q1 First Quartile- -median of the first half of the data Q3 Third Quartile- -median of the second half of the data Interquartile Range (IQR): -range of the middle 50% of the data IQR = Q3 – Q1 Quartiles and IQR are resistant because they are not effected by a few extreme observations
Identifying Outliers An observation is considered an outlier if it falls more than (1.5 x IQR) above the third quartile or below the first quartile Any time you find outliers in your data, try to find an explanation for them
To get a quick summary of both center and spread: The Five Number Summary- (Written in order from smallest to largest) Minimum, Q1, M, Q3, Maximum These 5 numbers divide each distribution roughly into quarters
How to Make a Boxplot -Start with a number line in equal intervals and includes all of your data -A box is drawn from Q1 to Q3 -A vertical line in the box marks the median -Horizontal lines extend from the box out to the smallest and largest observations that are not outliers Boxplots show less detail than histograms or stemplots so they are best used for side-by-side comparison of more than one distribution
Find the range, Q1, Q2, Q3, IQR, and check for outliers then draw a boxplot of the data: • 1 2 2 4 4 5 7 8 9 10 11 12 13 Range- Q1- Q2- Q3- IQR- 13 – 1 = 12 3 7 10.5 10.5 – 3 = 7.5
Find the range, Q1, Q2, Q3, IQR, and check for outliers then draw a boxplot of the data: • 1 2 2 4 4 5 7 8 9 10 11 12 13 IQR = IQR x 1.5- Q1 – (IQR x 1.5)- Q3 + (IQR x 1.5)- 7.5 11.25 3 – 11.25 = – 8.25 10.5 + 11.25 = 21.75 All of data are between – 8.25 and 21.75 So there are NO outliers.
Find the range, Q1, Q2, Q3, IQR then draw a boxplot of the data: • 1 2 2 4 4 5 7 8 9 10 11 12 13 1 2 3 4 5 6 7 8 9 10 11 12 13
Find the range, Q1, Q2, Q3, IQR, and check for outliers then draw a boxplot of the data: • 1.2 13.1 18.5 19.7 21.1 21.3 22.3 31.1 Range- Q1- Q2- Q3- IQR- 31.1 – 1.2 = 29.9 (Between 13.1 and 18.5) = 15.8 (Between 19.7 and 21.1) = 20.4 (Between 21.3 and 22.3) = 21.8 21.8 – 15.8 = 6
Find the range, Q1, Q2, Q3, IQR, and check for outliers then draw a boxplot of the data: • 1.2 13.1 18.5 19.7 21.1 21.3 22.3 31.1 IQR = IQR x 1.5- Q1 – (IQR x 1.5)- Q3 + (IQR x 1.5)- 6 9 15.8 – 9 = 6.8 21.8 + 9 = 30.8 NOT all of data between 6.8 and 30.8 Outliers: 1.2 and 31.1
Find the range, Q1, Q2, Q3, IQR then draw a boxplot of the data: • 1.2 13.1 18.5 19.7 21.1 21.3 22.3 31.1 0 3 6 9 12 15 18 21 24 27 30 33
Dot Plots- Each data value is shown as a dot above its location on a horizontal number line EX: Make a dot plot from the following data: 12 15 11 12 9 13 14 13 9 10 11 12 13 14 15