Download
1 / 6
60 likes | 222 Views
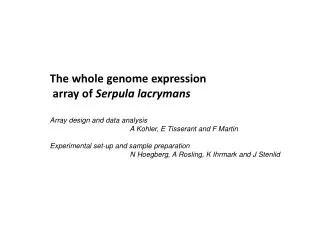
The whole genome expression array of Serpula lacrymans Array design and data analysis A Kohler, E Tisserant and F Martin Experimental set-up and sample preparation N Hoegberg, A Rosling, K Ihrmark and J Stenlid . NimbleGen Serpula Expression Oligoarray.

E N D
The whole genome expression array of Serpula lacrymans Array design and data analysis A Kohler, E Tisserant and F Martin Experimental set-up and sample preparation N Hoegberg, A Rosling, K Ihrmark and J Stenlid
NimbleGen Serpula Expression Oligoarray -Serpula lacrymans S7.9 Slacrymansv1.FilteredModelsv1.transcripts - 72,000 60-mer (5 probes per gene model) Starting number of sequences: 12917 Sequences with probes: 12909 Exemplars (five identical probes for several models): 112 Sequence with no probes: 8 -BLOCK1 - contains 63947 experimental probes -1200 randomly chosen gene models in duplicate (5960 probes) -RANDOM – contains 2130 randomly generated probes - these can be used as negative controls
NimbleGen Pair-file (raw data) Oligo filter: non-specific oligos were eliminated from the file (an oligo was considered as non-specific if it shares more than 90% homology with a gene model other than the gene model it was made for) Data analysis procedure Filtered Pair-file 11803 gene models with expression data RMA normalisation (using ArraySTAR software) Filtered Norm-call-file From the random-oligos present on the array the mean expression value was calculated. The three-fold of the mean expression value of the random oligos was considered as cut-off value for « gene expression » and substracted from each value. If the expression value became negativ, it was set to 1 Cut-off corrected file Calculation of mean expressions; fold expression; Student t-test with FDR (Benjamin Hohberg) multiple testing correction (using ArraySTAR software) Result file
Principal components analysis Goethite 30d MMN 30d FeCL2 10d FeCL2 + Goethite 10d Goethite 10d Wood 30d Wood 10d MMN 10d FeCL2 + Goethite 30d
Most highly up-regulated transcripts by growth on wood compared to MMN medium