Download
1 / 35
350 likes | 471 Views
Maine Waste Composition Study. Discovering Resources in Maine’s Trash. Background. Project began in Summer of 2011 Sampled waste of 17 municipalities and regional transfer stations twice each Looked at both composition of waste along with method for recycling and waste stream

E N D
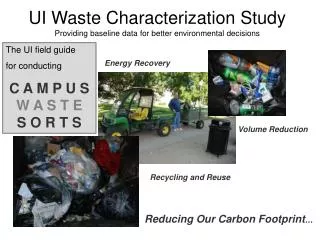
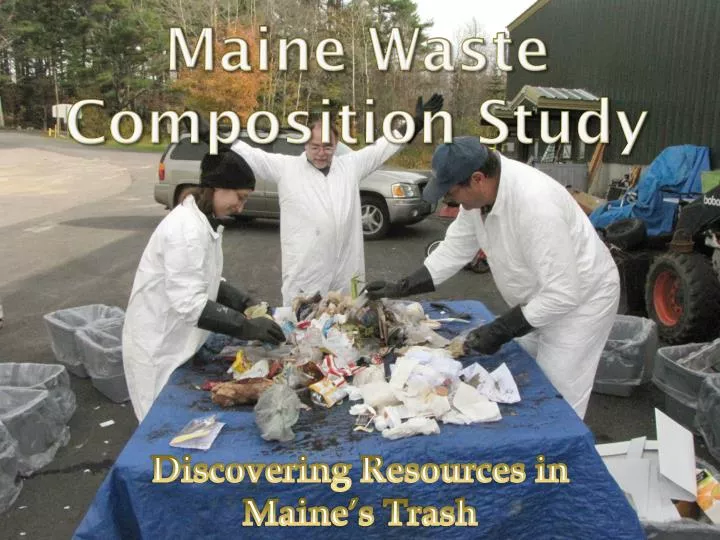
Maine Waste Composition Study Discovering Resources in Maine’s Trash
Background • Project began in Summer of 2011 • Sampled waste of 17 municipalities and regional transfer stations twice each • Looked at both composition of waste along with method for recycling and waste stream • Only sampled residential “baggable” waste
Why Waste Composition now? • Improving waste management should be a targeted effort • 20 years since its inception, the 50% recycling goal has not yet been reached (currently ~ 39%) • Knowing composition will help lead to the most efficient plan of attack • No study of Maine waste has been conducted since 1991/1992 and it is prudent to assume it has changed
Categorization • Waste was broken into 9 major categories • Organic, Paper, Plastic, Other, Construction and Demolition, Metal, Glass, Household Hazardous, and Electronics • Over 60 subcategories were used
A Day Sorting Waste • Collect sample of waste (no. of bags varied by location) • Broke open each bag and settled contents • Sorted into both final subcategories and several category groupings • Weighed bins, tallied results, and emptied contents as bins became full • Resorted bins with groupings as needed or at the end of the day
Comparison to 1991/1992 Study • Paper percentage of total waste stream decreased by 23% • Significant decreases in Cardboard and High Grade Office Paper • Substantial decrease (75%) in Newsprint
Comparison to 1991/1992 Study • Plastics bag waste cut in half • Rigid plastics has increased by 160% • Plastic percentage of total waste stream has doubled • Plastic Film waste much of increase
Comparison to 1991/1992 Study Metal stays consistent while individual categories have varied from1992 Glass has decreased by a third with Clear Glass Containers decreasing by 30% from 1992
Variations in Recyclable MaterialNewsprint • Broken down by town sampled, variations are apparent • Distribution skewed to the right • Some towns have much better recovery rates
Variations in Recyclable MaterialClear Glass • Distribution is tighter for clear glass containers and near normal • Standard deviation is less than half of newsprint
Notes on Stream Classification • Classification is by: • What is widely recycled around the state • Compostable without significant effort • What is currently not diverted in a significant amount of locations around the state • Not a perfect analysis due to fungible nature between categories of many items.
Topics for Discussion • Where can the next advances in recycling come? • What can be improved? • Methods, actions, enforcement, technology. • What can be added and/or promoted everywhere? • Textiles, film, grocery bags, hard plastics not #1-7, composites, etc.
Topics for Discussion • How can we better utilize compositing to decrease the waste stream • Regional composting? • Is it feasible? Cost-effective? What process should be used? Can we control the smell? • Backyard composting • Public perception, animal issues, individual responsibility.
Topics for Discussion • What are best practices in Waste Management? • Pay-as-you-throw, Single-Stream, curbside collection, drop-off, mandatory recycling, HHW collection, citizen education, etc.
Take-Home’s • State is still not near 50% recycling goal • Waste composition has transformed with time • Plastic waste on rise as paper and glass decline • Recyclables in waste stream is over 20% and compostable material is nearly 40% • Top 10 waste subcategories account for 73.05% of the waste • There are widespread variations by town and by subcategory that are observed