Download
1 / 30
300 likes | 573 Views
State-wide Waste Composition Draft Results. PROP Data Management Workshop October 31, 2002. Objective. Provide an overview of the range of results available from the State-wide Waste Composition project Present examples of how to apply the results to your planning efforts

E N D
State-wide Waste Composition Draft Results PROP Data Management Workshop October 31, 2002
Objective • Provide an overview of the range of results available from the State-wide Waste Composition project • Present examples of how to apply the results to your planning efforts • Introduce Recycling Composition Study sample results • Obtain feedback on data needs
Disposal vs. Generation • Disposal: MSW that is disposed or incinerated (excludes recycled materials) • Generation: Includes all MSW that is recycled and disposed or incinerated • Report Focus: Disposed MSW • Computer Model: Disposed and recycled MSW
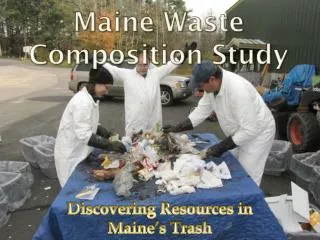
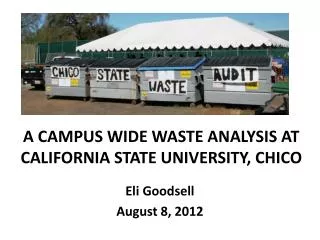
Summary of Field Data Collection • Over 1,100 samples of waste physically sorted • Sampling Plan designed to achieve representation by • DEP Region • Demographic area • Urban • Suburban • Rural • Generating Sector • Residential • Commercial
Data Management Procedures • Raw data collected on custom forms • Data entry on specially-designed spreadsheet • QC round 1 • Sample weights converted to percentages and statistically analyzed via custom database • QC round 2 • Sample data aggregated based on generation indicators
Statistical Measures and Methods • “Representativeness” of Samples • Sample Mean Composition • Confidence Intervals • Level of Confidence • Sampling Error • Weighted Average Aggregation
Residential-Households Commercial-Employment Waste Disposal Quantities Aggregation of Data • 36 Discrete Waste Sub-streams! • Aggregated by: • The result—LOTS OF NUMBERS!
Enough Statistics! Wake up!!!
Aggregate Waste Composition Aggregate Composition by DEP Region
Variation in Waste Composition Comparison of Selected Demographic/Generator Pairs
Diversion Opportunities No. of Regions in which material is in Top 10
Improvement on National Data [1] Source: Municipal Solid Waste in the U.S. 2000
FAQs • “My county is about half suburban and half rural. What materials should I target in each area to achieve additional diversion?” • “There are extensive residential recycling programs in place in my community, but no significant commercial recycling. What should I target in the commercial stream?”
FAQs (continued) • “Which recycled material markets do we need to develop to get the most bang for our recycling buck?” • “I don’t have reliable generation or disposal quantity data. What conclusions can I draw about my waste stream?”
Other Findings • Self-haul waste composition • Bulk waste composition • Composition of packaging and non-packaging in the waste stream
What Next? • Finalize Analysis and Report • Validate disposal and generation data • Develop Statistical Model • Demographic characteristics • Waste system characteristics • Distribute Beta Version of Model • Compile Feedback • Post Final Model on Internet for State-wide Use • Don’t forget the video!!!
Recycling Composition Study Update • All scheduled MRF sorts completed • Centre County: curb sort & drop-off • Northern Tier: curbs sort & drop-off • Lackawanna County: dual stream curbside • Pittsburgh Recycling: blue bag and dual stream curbside • Waste Management (York): single stream curbside
Questions to be Answered • How much do contamination rates vary… • By collection method? • By generator? • By program? • How much recyclable material is lost during processing?
Questions (continued) • How prevalent is recovery of single-serve containers? • What is the composition of mixed paper being recovered? • What is the composition of “commingled containers” reported as a lump sum?
Incoming Material Composition Millheim Borough Drop-off Material Centre COG Curbsort Material Note: Preliminary results only. Actual results may differ from those shown.
Recycling “Yield Loss” Northern Tier MRF Container Sort Line Residue Composition Note: Preliminary results only. Actual results may differ from those shown.
Single-Serve Plastics Composition Lackawanna County MRF Recovered #1 PET Composition Note: Preliminary results only. Actual results may differ from those shown.
Schedule • Waste Composition Study • Report—November 14 • Educational Video—December 15 • Model Development—January 15, 2003 • Recycling Composition Study • Analysis & report—December 15