Download
1 / 134
1.35k likes | 1.53k Views
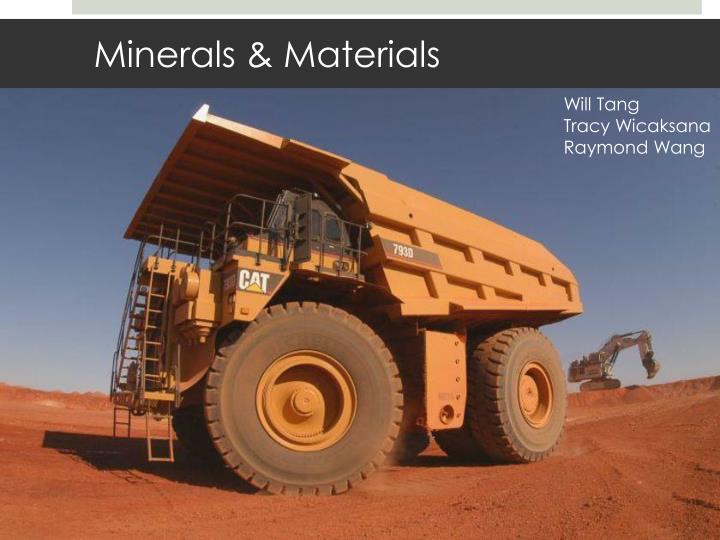
Will Tang Tracy Wicaksana Raymond Wang. Minerals & Materials. Agenda. Industry overview BHP Billiton Barrick Xstrata. Mining Industry Overview. Mining is the extraction of valuable minerals or other geological materials from the earth, from an ore body, vein or (coal) seam.

E N D
Will Tang Tracy Wicaksana Raymond Wang Minerals & Materials
Agenda • Industry overview • BHP Billiton • Barrick • Xstrata
Mining Industry Overview • Mining is the extraction of valuable minerals or other geological materials from the earth, from an ore body, vein or (coal) seam.
Financial Structure • Cost Structure • Exploration, research and development • General operation costs • Depreciation, depletion and amortization • Interest expenses • Other • Revenue Composition • Financial activities revenue (ie. Hedging) • Mining revenue • Interest income revenue
Mining Industry Overview • Risk Factors • Development and operation • Commodity price • Interest rate risk • The global financial crisis • Foreign exchange rate fluctuations • Government and political risks, licenses and permits • Health, safety, environmental and accidents • Energy Risk • Derivative Instrument Risk • Credit risk • Market liquidity risk • Mark-to-market risk • Others
Gold • Market value The global gold market grew by 41.1% in 2010 to reach a value of $83.8 billion. • Market value forecast In 2015, the global gold market is forecast to have a value of $131.5 billion, an increase of 57% since 2010. • The gold market is usually in contango • Over the counter trade (OTC)
Market Demand India (27%), China, and the Middle East accounted for approximately 70% of world demand in 2009.
Alternative Investment • Safe Haven • Generally speaking, when people feel secure, gold prices fall; when people feel insecure, prices rise. This is reflected by the short term demand fluctuation. • Alternative investment to USD (uncertainty)
Price Driver • Increase of gold holding • Global gold mine production declining • Gold sales form the official sector under the Central Bank Gold Agreement (CBGA). Central banks became net buyers of gold in 2010 for the first time in 21 years.
Copper • An Internationally traded commodity • Infinite recyclable life • Prices (Contango): • Volatile • Cyclical • Determined by the major metals exchanges • New York Mercantile Exchange (COMEX) • London Metals Exchange (LME) • Shanghai Futures Exchange (SHFE0) • Price might also be affected through speculative trading and currency exchange
Copper Demand • Factors affecting demand • Global Economic Conditions • Instability Decreases Demand (US. and Europe) • Industrialization • Increases consumption (China and India) • Copper imports by China advanced to a record in 2009, driving global prices up 140 percent.
COAL • The world’s most abundant and widely distributed fossil fuel • Was the most important source of the world’s primary energy until it was taken over by the oil in the late 1960s • 70% of the total world coal production is consumed for electricity generation (Thermal Coal) • Other uses: steel production(Coking Coal), cement manufacturing, and as a liquid fuel
COAL Consumption • Consumption: • China: 2.7 billion tons • US: 1.02 billion • Worldwide: 6.65 billion tons
ZINC • Zinc is the 4th most common metal • More than 50 countries around the world mine zinc ore, with the largest producers : Australia, Canada, Peru, and the United States • Mining methods: • Mined underground: 80% of the world’s zinc • Mined in open pits: 8% of the world’s zinc • Combination: 12% of the world’s zinc
Iron Ore • Elemental Iron is ranked 4th in abundance in the earth’s crust and is the major constituent of the Earth’s core • 98% of iron ore is used to make steel • Major producers of iron ore include Australia, Brazil, China, Russia and India
Company Overview • A global mining, oil and gas company • Based in Melbourne, Australia and with a major management office in London, United Kingdom • The world’s largest mining company measured by revenue • The world’s third-largest company measured by market capitalization • In 2001, Billiton Plc merged with the Broken Hill Proprietary Company Limited(BHP) to form BHP Billiton
Executives Chairman: Jacques Nasser After serving as a Director of BHP Billiton Since 2006, he was appointed Chairman on March 31, 2010 33 year career with Ford From 1998 to 2001, President and CEO of Ford Motor Company CEO: Dr. Marius Kloppers In 2007, he was appointed CEO of BHP Billiton Before joining Billiton in 1993, he worked with management consultants McKinsey & Co in Netherlands
Operation Operating in nine businesses: Petroleum Aluminum Base Metals (including Uranium) Diamonds & Specialty Products Stainless Steel Materials Iron Ore Manganese Metallurgical Coal
Production volumes • for this year and the previous 2 years
Operating & Financial review • Financial strength and discipline: • A solid “A” credit rating • Capital management priorities are: • Reinvest in our extensive pipeline of world-class • Ensure a solid balance sheet • Return excess capital to shareholders
Consolidated Statement of Comprehensive Income For the year ended 30 June 2011
Financial Risk Factors • Commodity price risk • Currency exchange rate risk • Interest rate risk • Counterparty credit risk