Download
1 / 46
460 likes | 582 Views
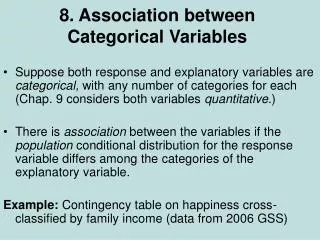
Inference for Categorical Variables 2/29/12. Single Proportion, p Distribution Intervals and tests Difference in proportions, p 1 – p 2 One proportion or two? Distribution Intervals and tests. Section 6.1, 6.2, 6.3, 6.7, 6.8, 6.9. Professor Kari Lock Morgan Duke University.

E N D
Inference for Categorical Variables • 2/29/12 • Single Proportion, p • Distribution • Intervals and tests • Difference in proportions, p1 – p2 • One proportion or two? • Distribution • Intervals and tests • Section 6.1, 6.2, 6.3, 6.7, 6.8, 6.9 • Professor Kari Lock Morgan • Duke University
To Do • Homework 5 (due Monday, 3/12) • Project 1 (due Thursday, 3/22) • (NOTE: DUE DATE HAS CHANGED)
Central Limit Theorem! For a sufficiently large sample size, the distribution of sample statistics for a mean or a proportion is normal
Interval Using N(0,1) IF SAMPLE SIZES ARE LARGE… A confidence interval can be calculated by where z*is a N(0,1) percentile depending on the level of confidence.
SE of a Proportion • The standard error for a sample proportion can be calculated by *Notice the sample size in the denominator… as the sample size increases, the standard error decreases
Paul the Octopus • If he is truly guessing randomly, then p = 0.5 so the SE of his sample proportion correct out of 8 guesses is
Paul the Octopus This is the same value we get from a randomization distribution… www.lock5stat.com/statkey
Paul the Octopus • If Paul really does have psychic powers, and can guess the correct team every time, then p = 1, and
CLT for a Proportion • If counts for each category are at least 10 (np ≥ 10 and n(1 – p) ≥ 10), then
Standard Error • One small problem… if we are doing inference for p, we don’t know p! • For confidence intervals, use your best guess for p:
Duke vs UNC Men’s Basketball In head-to-head match ups Duke vs UNC in men’s basketball, UNC has won 131 and Duke has won 102. What is Duke’s probability of winning on Saturday? What do we have to assume? Is this reasonable??? Find a 95% CI.
Duke vs UNC Men’s Basketball Counts are greater than 10 in each category For a 95% confidence interval, z* = 2
Other Levels of Confidence http://davidmlane.com/hyperstat/z_table.html Technically, for 95% confidence, z* = 1.96, but 2 is much easier to remember, and close enough
z* on TI-83 P% -z* z* • 2ndDISTR 3: invNorm( Proportion below z* • (for a 95% CI, the proportion below z* is 0.975)
Margin of Error • For a single proportion, what is the margin of error?
Margin of Error • You can choose your sample size in advance, depending on your desired margin of error! • Given this formula for margin of error, solve for n.
Margin of Error Suppose we want to estimate a proportion with a margin of error of 0.03 with 95% confidence. How large a sample size do we need? About 100 About 500 About 1000 About 5000
Tests Using N(0,1) • IF SAMPLE SIZES ARE LARGE… • A p-value is the area in the tail(s) of a N(0,1) beyond
z-statistic If z = –3, using = 0.05 we would (a) Reject the null (b) Not reject the null (c) Impossible to tell (d) I have no idea About 95% of z-statistics are within -2 and +2, so anything beyond those values will be in the most extreme 5%, or equivalently will give a p-value less than 0.05.
Hypothesis Testing For hypothesis testing, we want the distribution of the sample proportion assuming the null hypothesis is true What to use for p?
Hypothesis Testing The p-value is the area in the tail(s) beyond z in a N(0,1)
Duke vs UNC Men’s Basketball Using α = 0.05, is this evidence that one team is/was better than the other (combining past and present)? (a) Yes (b) No (c) No idea
Duke vs UNC Men’s Basketball Counts are greater than 10 in each category Based on this data, we cannot conclude that either Duke or UNC is significantly better.
p-value on TI-83 • 2nd • DISTR • 3: normalcdf( • lower bound, upper bound • Hint: if you want greater than 2, just put 2, 100 (or some other large number) P%
One Proportion or Two? • Two proportions: there are two separate categorical variables • One proportion: there is only one categorical variable
One Proportion or Two? • Of residents in the triangle area, on Saturday night will the proportion of people cheering for Duke or UNC be greater? How much greater? • Inference for one proportion • Inference for two proportions • (Note: assume no one will be cheering for both)
One Proportion or Two? • Who is more likely to be wearing a blue shirt on Saturday night, a UNC fan or a Duke fan? • Inference for one proportion • Inference for two proportions
CLT for If counts within each category (each cell of the two-way table) are at least 10
Metal Tags and Penguins Are metal tags detrimental to penguins? A study looked at the 10 year survival rate of penguins tagged either with a metal tag or an electronic tag. 20% of the 167 metal tagged penguins survived, compared to 36% of the 189 electronic tagged penguins. Give a 90% confidence interval for the difference in proportions. Source: Saraux, et. al. (2011). “Reliability of flipper-banded penguins as indicators of climate change,” Nature, 469, 203-206.
Metal Tags and Penguins We are 90% confident that the survival rate is between 0.09 and 0.237 lower for metal tagged penguins, as opposed to electronically tagged.
Metal Tags and Penguins www.lock5stat.com/statkey
Hypothesis Testing What should we use for p1 and p2 in the formula for SE for hypothesis testing?
Pooled Proportion Overall sample proportion across both groups. It will be in between the two observed sample proportions.
Hypothesis Testing The p-value is the area in the tail(s) beyond z in a N(0,1)
Metal Tags and Penguins 20% of the 167 metal tagged penguins survived, compared to 36% of the 189 electronic tagged penguins. Are metal tags detrimental to penguins? (a) Yes (b) No (c) Cannot tell from this data
Metal Tags and Penguins Are metal tags detrimental to penguins?
Metal Tags and Penguins http://davidmlane.com/hyperstat/z_table.html This is very strong evidence that metal tags are detrimental to penguins.
Metal Tags and Penguins www.lock5stat.com/statkey
Accuracy • The accuracy of intervals and p-values generated using simulation methods (bootstrapping and randomization) depends on the number of simulations (more simulations = more accurate) • The accuracy of intervals and p-values generated using formulas and the normal distribution depends on the sample size (larger sample size = more accurate) • If the distribution of the statistic is truly normal and you have generated many simulated randomizations, the p-values should be very close
Summary • For a single proportion: • For a difference in proportions: