Download
1 / 20
420 likes | 817 Views
+. +. +. +. +. +. +. +. +. +. +. +. +. +. +. +. +. +. +. +. +. +. +. +. +. +. +. +. +. +. +. +. +. +. +. +. +. +. +. +. +. +. +. +. +. +. +. +. Treatment Conditions. +. +. +. +. +. +. +. +. +. +. +. +. +. +. +. +. +. +. +. +. +.

E N D
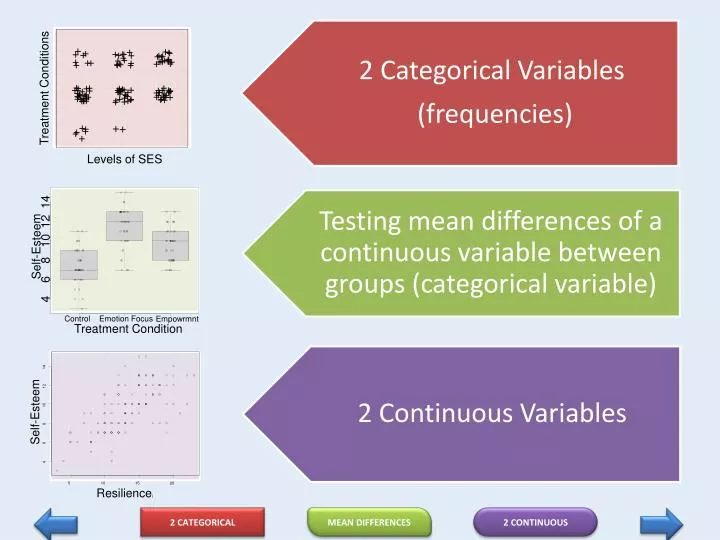
+ + + + + + + + + + + + + + + + + + + + + + + + + + + + + + + + + + + + + + + + + + + + + + + + Treatment Conditions + + + + + + + + + + + + + + + + + + + + + + + + + + + + + + + + + + + + + + + + + + + + + + + + + + + + + + + + + + + + + + + + + + + + + + + + Levels of SES 14 12 10 Self-Esteem 8 6 4 Control Emotion Focus Empowrmnt Treatment Condition 14 12 10 Self-Esteem 8 6 4 5 10 15 20 Resilience) • 2 Categorical Variables • (frequencies) • Testing mean differences of a continuous variable between groups (categorical variable) • 2 Continuous Variables 2 CATEGORICAL MEAN DIFFERENCES 2 CONTINUOUS
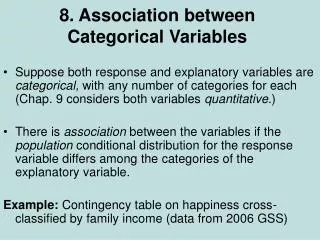
2 Categorical Variables 2 CATEGORICAL MEAN DIFFERENCES 2 CONTINUOUS
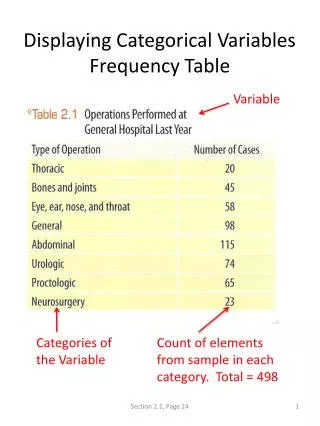
Describing Categorical Variables: Frequencies Analyze> Descriptive Statistics> Frequencies Charts... button Drop categorical variables into the Variable(s) box Choose either Bar charts or Pie charts to graph categorical variables. 2 CATEGORICAL MEAN DIFFERENCES 2 CONTINUOUS
Describing Categorical Variables: Crosstabulation Analyze> Descriptive Statistics> Crosstabs Cells... button Use the Crosstabs to report frequencies between two variables and create clustered bar charts. For descriptives: choose to display Percentages in each cell. 2 CATEGORICAL MEAN DIFFERENCES 2 CONTINUOUS
Analyzing Two Categorical Variables: Chi-square statistics Crosstabs> Statistics... button Cells... button Request Chi-square to test the independence between the variables and Phi and Cramer’s V as effect sizes. To understand the relationship between the two categorical variables request Standardized Residuals and Expected Values 2 CATEGORICAL MEAN DIFFERENCES 2 CONTINUOUS
Compare Mean Differences 2 CATEGORICAL MEAN DIFFERENCES 2 CONTINUOUS
Descriptives for Mean Comparisons Analyze> Descriptive Statistics > Frequencies Statistics... button You can also use Frequencies to get statistics for continuous variables. 2 CATEGORICAL MEAN DIFFERENCES 2 CONTINUOUS
Descriptives for Mean Comparisons Analyze> Descriptive Statistics > Frequencies Charts... button ...and also to request the histogram with the normal curve. You can also use Frequencies to get statistics for continuous variables. 2 CATEGORICAL MEAN DIFFERENCES 2 CONTINUOUS
Descriptives for Mean Comparisons Analyze> Descriptive Statistics > Descriptives Options... button Alternatively you can use Descriptives, but you will have to use Explore (next slide) without a Factor List variable to get the histograms, boxplots and tests of normality for the whole sample 2 CATEGORICAL MEAN DIFFERENCES 2 CONTINUOUS
Descriptives for Mean Comparisons Analyze> Descriptive Statistics > Explore Plots... button Use Explore to produce the descriptives of a continuous variable at levels of a categorical variable. On the Plots button change the Stem-and Leaf for a Histogram and choose Normality plots with tests. You may disregard the normality plots (except the boxplot). Normality tests are read: If significant, the variable is not normally distributed, if not significant the variable is normallly distributed. 2 CATEGORICAL MEAN DIFFERENCES 2 CONTINUOUS
Tests for Mean Comparisons: t test for two groups Analyze> Compare Means> Independent Samples t-test Define Groups... button You may test at the same time different continuous variables for differences between two groups defined by a categorical variable. Remember to check for homogeneity of variances. If the test is significant read the “Equal Variances Not Assumed” row, the second. If the test is not significant read the “Equal Variances Assumed” row, the first row. 2 CATEGORICAL MEAN DIFFERENCES 2 CONTINUOUS
Tests for Mean Comparisons: One-way ANOVA for more than 2 groups Analyze> Compare Means> One Way ANOVA Options... button If your categorical variable separates your sample in more than two groups you have to use a one way ANOVA test. Unlike the t-test, homogeneity of variance tests are not produced by default. You have to request them on the Options button 2 CATEGORICAL MEAN DIFFERENCES 2 CONTINUOUS
Tests for Mean Comparisons: One-way ANOVA for more than 2 groups Analyze> Compare Means> One Way ANOVA Post Hoc... button These are some of the most commonly used Post-hoc tests. You should request them in the same step as your ANOVA. They are somewhat equivalent to running multiple t-tests among the different group combinations. If the ANOVA test is significant you have to check for the pairwise (between two groups) comparisons using the Post-Hoc button. 2 CATEGORICAL MEAN DIFFERENCES 2 CONTINUOUS
Descriptives for Mean Comparisons Analyze> Descriptive Statistics > Descriptives Options... button Alternatively you can use Descriptives, but you will have to use Explore (next slide) without a Factor List variable to get the histograms, boxplots and tests of normality for the whole sample 2 CATEGORICAL MEAN DIFFERENCES 2 CONTINUOUS
Descriptives for Mean Comparisons Analyze> Descriptive Statistics > Descriptives Options... button Alternatively you can use Descriptives, but you will have to use Explore (next slide) without a Factor List variable to get the histograms, boxplots and tests of normality for the whole sample 2 CATEGORICAL MEAN DIFFERENCES 2 CONTINUOUS
2 Continuous Variables 2 CATEGORICAL MEAN DIFFERENCES 2 CONTINUOUS
Descriptives for 2 Continuous Variables Analyze> Descriptive Statistics > Frequencies Statistics and Charts... buttons The same as with the continuous variables you want to compare means, you can use the Frequencies to get descriptive statistics and the histogram with the normal curve. You can also get similar information with the Descriptives and Explore as shown above. 2 CATEGORICAL MEAN DIFFERENCES 2 CONTINUOUS
Correlations Between Two Continuous Variables Analyze> Correlate> Bivariate • Choose either Pearson or Spearman depending on the normality of the test. • Pearson is the usual correlation on continuous variables • Spearman runs the correlation on the ranked data and it is used with there are not many cases or there are outliers that will bias the correlation. 2 CATEGORICAL MEAN DIFFERENCES 2 CONTINUOUS
Partial Correlation of Two Continuous Variables Controlling for a Third one Analyze> Correlate> Partial • Cannot use it for Spearman correlation • There can be more than one “Controlling for” variables. • The “Controlling for” variables can be either continuous or categorical with only two levels. 2 CATEGORICAL MEAN DIFFERENCES 2 CONTINUOUS
Graphs for 2 Continuous Variables Graphs> Chart Builder • After selecting Scatter/Dot drag or double click the first one on the left top corner into the chart area. • Then select the two continuous variables one to each of the axis and click ok. 2 CATEGORICAL MEAN DIFFERENCES 2 CONTINUOUS