Download
1 / 9
100 likes | 190 Views
Categorical Variables in Scatterplots. Section 3.1.2. Starter 3.1.2. Write one example of a random variable that you think would have a normal distribution (other than rolling two dice). Write why you think it would be approximately normal.

E N D
Categorical Variables in Scatterplots Section 3.1.2
Starter 3.1.2 • Write one example of a random variable that you think would have a normal distribution (other than rolling two dice). Write why you think it would be approximately normal. • Write one example of a different random variable that you think would have a uniform distribution (other than rolling one die). Write why you think it would be approximately uniform.
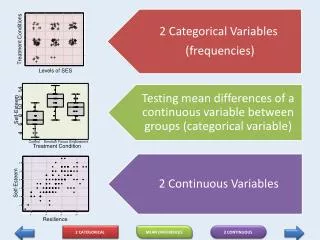
Today’s Objectives • Students will construct and interpret a scatterplot with 3 variables, one of which is categorical
Return to the Sanchez data • Yesterday you looked at 16 months of data showing gas usage as a function of degree-days (coldness). • You stored the data in lists GASDA and GASFT • Now suppose that the Sanchez family decided to add solar heating to their house and collected more data. • I have stored the new data in two lists called GASD2 (degree-days) and GASF2 (100 cu. ft. used) • Link calculators and get these data from me. • I’m also giving you: MASSF, MASSM, METF, METM for use in the next activity
Display the new scatterplot • Set Plot 1 in your calculator to show a scatterplot of GASDA and GASFT. • Set Plot 2 to show a scatterplot of GASD2 and GASF2. • Tap Zoom 9 to see the display. • Can you tell which points represent the new data AFTER solar panels were put in? • Probably not, so change the mark in Plot 2 to a plus instead of a box • Write a brief verbal description of the difference between the two plots. • What do you conclude in the context of this problem?
Both graphs have strong positive linear relationships, but the “plus” graph has a lower slope which means that as the months get colder, the gas usage goes up more slowly with solar panels than without.
Classwork ActivityProblem 3.9, page 120 • Does body mass affect metabolic rate? Is there a difference by gender? The data are in the lists I gave you: • MASSM is the body mass of 7 men • METM is the metabolic rate of those men • MASSF and METF are the data for 12 women • Make a scatterplot on the TI of the men’s data • Add a scatterplot of the women’s data • Write a paragraph that describes each association and any differences between them
Today’s Objectives • Students will construct and interpret a scatterplot with 3 variables, one of which is categorical
Homework • Read pages 117 – 122 • Do problems 10 – 13, 17