Download
1 / 41
410 likes | 543 Views
Cross-Tabs With Nominal Variables. 10/24/2013. Readings. Chapter 7 Tests of Significance and Measures of Association (Pollock) (pp. 155-169 ) Chapter 5 Making Controlled Comparisons (Pollock Workbook ) Chapter 7 Chi-Square and Measures of Association (Pollock Workbook ).

E N D
Cross-Tabs With Nominal Variables 10/24/2013
Readings • Chapter 7 Tests of Significance and Measures of Association (Pollock) (pp. 155-169) • Chapter 5 Making Controlled Comparisons (Pollock Workbook) • Chapter 7 Chi-Square and Measures of Association (Pollock Workbook)
Office Hours For the Week • When • Friday 10-11 • Monday 10-12 • Tuesday 8-12 • And by appointment
Course Learning Objectives • Students will be able to interpret and explain empirical data. • Students will achieve competency in conducting statistical data analysis using the SPSS software program.
A test of statistical significance Chi-square
What is Chi-Square? • A test of significance between two categorical variables • We run the test in conjunction with cross-tabs
Things about Chi-Square • It is not a test of strength, just significance • Chi-square is inflated by large samples • It is a test that tries to disprove the null hypothesis. • An insignificant chi-square means that no relationship exists.
Chi-Square is an up or down measure • if our Chi-Square significance value from our test is greater than .05 we accept the null hypothesis and we have no relationship • If our significance value is less than or equal to.05 table, we reject the null hypothesis- we have a relationship
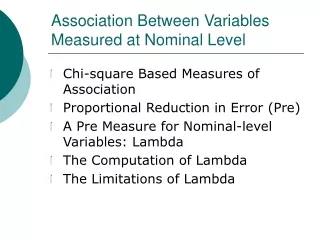
Nominal Variables Measures of Association
Why Measures of Association • Chi-Square only tests for significance • It does not say how strongly the variables are related • We Use a Measure of Association to Do this
A measure of association is a single number that reflects the strength of the relationship
Measures of association for Nominal Variables tell us: • Strength of the Relationship • The statistical significance of the relationship • These go hand in hand
A value of 1.00 means a perfect relationship, a value of .000 means no relationship
Lambda • What kinds of variables are needed for Lambda? • Lambda ranges from 0 (no relation) to 1 (a perfect relationship) • It measures how much better one can predict the value of each case on the DV if one knows the value of the IV
Interpreting Lambda • .000 to .10 none • .10-.20 weak • .20-.30 moderate • .30-.40 strong • .40 and above- there is a very strong relationship
Reading Lambda in SPSS • IN SPSS, LAMBDA GIVES YOU 3 DIFFERENT VALUES • Symmetric- always ignore • Two measures of your dependent variable • always use the lambda associated with your dependent variable. • If you place the dependent variable as the ROW VARIABLE, this will be the middle value. • Help from Rocky IV- And the video
Lambda Significance Value • The P-value for the test statistic (p<.05) • Is the association real or happening by chance?
The one in the middle Ignore these The significance of the Lambda p<.05
Lambda as a PRE Measure • Proportional Reduction in Error (PRE) • this is defined as the improvement, expressed as a Percentage, in predicting a dependent variable due to knowledge of the independent variable. • How well we can increase our prediction of the dependent variable by knowing the independent variable?
Converting a Lambda to a Percent • We take the value of our association measure • Multiply by 100% • this is our PRE value.
Problems with Lambda • It fears a TYPE I error (false alarm) so it is very conservative • Lambda can Underestimate relationships, even when there are significant chi-square values. • If the modal category is even, Lambda is pretty useless.
Phi and Cramer’s V Alternatives to Lambda
Cramer’s V • An alternative to Lambda • Ranges from 0 -1.0 • Not a Pre Measure
Phi • Measured similarly to Lambda • You will use this with 2x2 tables only
Phi And Cramer’s V Interpreting them Limitations Neither are PRE Measures They are both Chi-square based so large samples inflate it • .000 to .10 none • .10-.15 weak • .15-25 moderate • .25.- 40 strong • .40 and above- there is a very strong relationship
An Example • Here we can say with a .369 Cramer's V, that we have a strong relationship between our independent and dependent variables.
What the Cramer’s V Tells Us • If the Modal category is hard to predict, Lambda falls flat • What we see is a weak-to-moderate relationship here. • Independents and Democrats are different
Lambda Underestimating Part II D.V.- obama_win08 IV- Region
Lambda shows Nothing We have a moderate relationship, but it is not significant (small sample)
Easy to Do • How to do it in SPSS • Open States.SAV • Analyze • Descriptive • Cross-Tabs • Click on the Statistics Tab • Highlight your nominal variable statistics • Choose continue
Two Examples Region and Cig Taxes Region and Public Support for Gay Rights