Download
1 / 11
110 likes | 227 Views
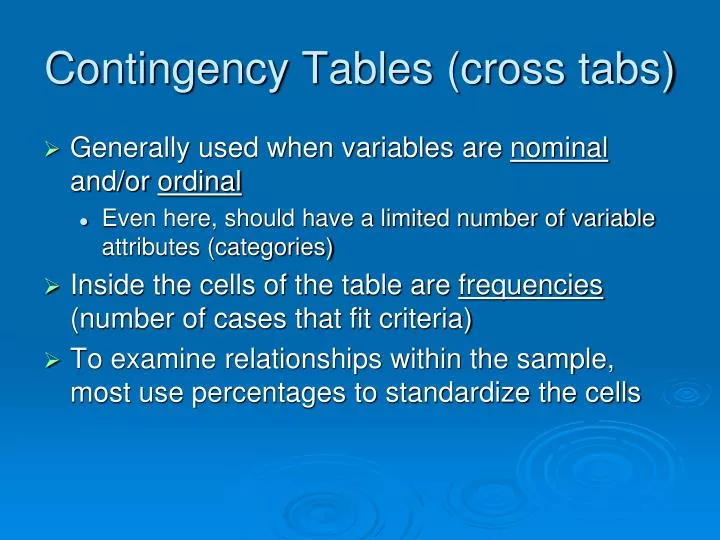
Contingency Tables (cross tabs). Generally used when variables are nominal and/or ordinal Even here, should have a limited number of variable attributes (categories) Inside the cells of the table are frequencies (number of cases that fit criteria)

E N D
Contingency Tables (cross tabs) • Generally used when variables are nominal and/or ordinal • Even here, should have a limited number of variable attributes (categories) • Inside the cells of the table are frequencies (number of cases that fit criteria) • To examine relationships within the sample, most use percentages to standardize the cells
Example • A survey of 2883 U.S. residents • Is one’s political ideology (liberal, moderate, conservative) related to their satisfaction with their financial situation? • Null = ideology is not related to satisfaction with financial status (the are independent) • Convention for bivariate tables • IV (Ideology) is on the top of the table (dictates columns) • The DV ($ status)is on the side (dictates rows).
The Test Statistic for Contingency Tables • Chi Square, or χ2 • Calculation • Observed frequencies (your sample data) • Expected frequencies (UNDER NULL) • Intuitive: how different are the observed cell frequencies from the expected cell frequencies • Degrees of Freedom: • 1-way = K-1 • 2-way = (# of Rows -1) (# of Columns -1)
Calculating • χ2 = ∑ [(fo - fe)2 /fe] • Where Fe= Row Marginal X Column Marginal N • So, for each cell, calculate the difference between the actual frequencies (“observed”) and what frequencies would be expected if the null was true (“expected”). Square, and divide by the expected frequency. • Add the results from each cell.
FIND EXPECTED FREQUENCIES UNDER NULL Example: 876(784)/2883 = 238
FIND EXPECTED FREQUENCIES UNDER NULL Example: 876(784)/2883 = 238
Calculating χ2 • χ2 = ∑ [(fo - fe)2 /fe] • [(242-238) 2 / 238 ] = .067 • [(300-332) 2 / 332 ] = 3.08 • Do the same for the other seven cells… • Calculate obtained χ2 • Figure out appropriate df and then Critical χ2 (alpha = .05) • Would decision change if alpha was .01?
Interpreting Chi-Square • Chi-square has no intuitive meaning, it can range from zero to very large • As with other test statistics, the real interest is the “p value” associated with the calculated chi-square value • Conventional testing = find χ2 (critical) for stated “alpha” (.05, .01, etc.) • Reject if χ2 (observed) is greater than χ2 (critical) • SPSS: find the exact probability of obtaining the χ2 under the null (reject if less than alpha)
SPSS Procedure • Analyze Descriptive Statistics Crosstabs • Rows = DV • Columns = IV • Cells • Column Percentages • Statistics • Chi square
Agenda • Today • Group based assignment (review for exam, review chi-square) • Monday • More “hands on” review for exam + final project time • Wednesday • Go over HW#4, review conceptual stuff, more practice