Download

1 / 39
420 likes | 601 Views
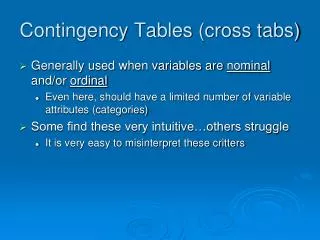
Cross-Tabs With Ordinal Variables. 10/29/2013. Readings. Chapter 7 Tests of Significance and Measures of Association (Pollock) (pp. 155-179) Chapter 5 Making Controlled Comparisons (Pollock Workbook ) Chapter 7 Chi-Square and Measures of Association (Pollock Workbook ).

E N D
Cross-Tabs With Ordinal Variables 10/29/2013
Readings • Chapter 7 Tests of Significance and Measures of Association (Pollock) (pp. 155-179) • Chapter 5 Making Controlled Comparisons (Pollock Workbook) • Chapter 7 Chi-Square and Measures of Association (Pollock Workbook)
Homework Due Today • Chapter 4: Pollock Workbook • Question 1 • A, B, C, D • Question 3 • A, B • Question 5 • A, B, C, D (a line chart, follow instructions in workbook) • Question 7 • A, B, C
Office Hours For the Week • When • Wednesday 10-11 • Thursday 8-12 • And by appointment
Course Learning Objectives • Students will be able to interpret and explain empirical data. • Students will achieve competency in conducting statistical data analysis using the SPSS software program.
Nominal Variables Measures of Association
Why Hypothesis Testing • To determine whether a relationship exists between two variablesand did not arise by chance. (Statistical Significance) • To measure the strength of the relationship between an independent and a dependent variable? (association)
Why Measures of Association • Chi-Square only tests for significance • It does not say how strongly the variables are related • We Use a Measure of Association to Do this
A measure of association is a single number that reflects the strength of the relationship
A value of 1.00 means a perfect relationship, a value of .000 means no relationship
Dichotomous Variables • When a variable takes on two values • In cross-tabs, you can treat dichotomous variables as ordinal!
Measures of association For Cross-Tabs Nominal Ordinal Strength Significance Direction! • Strength • Significance
For Ordinals • strength (measured as the distance away from zero) • significance (measured at the .05 level) • direction- This allows us to determine if we have a positive or negative relationship between our variables.
About these measures • all three are PRE measures. • each has a possible range of -1 to 1. As we approach -1 or 1 the stronger our relationship. A value of 0 (zero), means no relationship. • A positive number indicates a positive relationship, a negative value means a negative relationship.
Somers’ D Why D? Relationship Strengths Guidelines Under .1- very weak .10 and .15 weak .15 and .25 moderate .25-35 moderate-strong .35-.45 strong Above .45 very strong • You are able to test a specific dependent variable • It works for both square and rectangular tables • Use the one in the middle
A POSITIVE RELATIONSHIP • changes in the IV are associated with changes in the same direction for the DV. As the numbers of the IV increase, the numbers in the DV increases.
How it looks in a cross-tab • As people believe abortion should be more available, 1===>3. They are more likely to vote for Obama (0 to 1).
A NEGATIVE RELATIONSHIP • Changes in the IV are associated with changes in the reverse direction in the DV. As the numbers increase in the IV., the numbers in of the DV decrease
In SPSS • As states become more democratic (1-3), they have fewer abortion restrictions (3 to 1)
The Measures of Association A negative value does not mean a weak relationship. LOOK AT THE ABSOLUTE VALUE!!!!
Questions • What Percent of Americans believe that Jesus will definitely return in the next 40 years? • State the full directional relationship found in the cross tab. (people who are not born again Christians are….)
An Example • Maurice Duverger (1957) wrote that "the simple-majority single-ballot system favors the two-party system" and that "multimember districts favor multiple parties". Hypothesis- PR systems will have more parties • D.V. -enpp3_democ (Effective number of parliamentary parties: 3 cats) • IV-pr_sys (PR system)
Another One • From the states.sav • Hypothesis- States that are more secular, will have fewer restrictions on abortion • DV- abortlaw3 • IV- secularism3
Putting Outputs into Word • An Advantage of SPSS is incorporating outputs into documents • The best way to do this is to paste it as an image within your document
Copying From SPSS • Right Click on your output and choose copy
The “Paste Special Command” • The paste special command gives you the most options • Pasting as an image allows you to resize and move your output around the document Step 1 Step 2
What Not to Do • DON’T Just Cut and paste • It is more trouble than it is worth (resizing columns, spacing, etc)