Download
1 / 12
120 likes | 212 Views
PyMOL Evolutionary Trace Viewer 1.1. Lichtarge Lab Sept. 13, 2010. I. Basic sequence-evolution-structure analysis (ET1 or ET2). Load trace with structure from the ET Server (Ref. 2). Map ET rank data to a PyMOL structure. Vary the selection of ET residues. Assess clustering of ET residues.

E N D
PyMOL Evolutionary Trace Viewer 1.1 Lichtarge Lab Sept. 13, 2010
I. Basic sequence-evolution-structure analysis (ET1 or ET2) Load trace with structure from the ET Server (Ref. 2) Map ET rank data to a PyMOL structure Vary the selection of ET residues Assess clustering of ET residues Mark interface of the structure with another PyMOL structure or ligand
I.1 Load trace with structure from the ET server (Ref. 2) Enter a single PDB code with chain indicator. This will download a PDB chain into PyMOL and an ET ranks file. The boxes below automatically get filled with the correct information. This will open an internet browser and take the user to the ET Server search results.
I.2 Map ET rank data to a PyMOL structure and vary the selection of top ET-ranked residues Enter the PyMOL name of the structure. This structure must be present in the PyMOL graphics window. Optional chain indicator Check the box to compare the sequences between the structure and ET ranks file. Select an ET ranks file. The button opens a file selection window. Map ET rank data to the residues in the structure. Check the box to create a PyMOL selection of the ET residues. Vary selection of ET residues (Left mouse click, drag, then release). The slider value corresponds to a percent coverage. Select display options to distinguish ET residues from the rest of the structure.
I.3 Assess the statistical significance of the spatial clustering of top ET-ranked residues Select clustering measure (nobias, or with bias for residues more distant in sequence (Ref. 3)) Start computation of the ET clustering z-scores Clustering z-score of the top-ranked residues at the current ET rank threshold. Clustering z-score of the rest of the residues in the structure
I.4 Find interface residues on main ET1 structure Enter the PyMOL name of the partner structure. A structure with this name must be present in the PyMOL graphics window. Optional chain indicator This input distance refers to the atom-atom distance (Å) threshold between the interface residues of the partners. Start finding the interface residues between the main ET1 structure (e.g. 1finA) and the partner structure (e.g. 1finB) Select display option for interface residues (Color(red), Spheres, Sticks, PyMOL selection)
II. Zcoupling – ET coupling z-score computation (dependent on ET1 and ET2 pages) and interface selection (bottom) Start computation Computes the ET coupling z-score of the structures and current ET selections made with ET1 and ET2. Currently disabled The z-score and its components; Z=(c-<c>)/stdev (Ref. 5) Specify PyMOL structures. Must be present in the PyMOL graphics window. chain indicators (optional) Select display option for interface residues (Color(red), Spheres, Sticks, PyMOL selection) Start interface computation Interface selection is independent of the z-score computation.
III. Assembly tool – loading and viewing a PISA assembly (Ref. 6) Enter a single PDB code (e.g. 1got) to get the most probable PISA solution, or a PDB code with PISA assembly numbers (e.g. 1got:1,1 for the top solution). This will start the download of the multimer into PyMOL. PyETV will also attempt to match ET rank data from the ET server to each chain in the assembly. A page for each chain will be created below the Assembly page, organized into a tabbed folder. This will open an internet browser and take the user to the PISA search results.
III.1 Assembly tool – completion of Load Assembly Use the slider and select options to modify the ET residue selections for all chains in the assembly The page for each chain (A,C,E,…) operates like ET1 or ET2 (without the Load Trace feature)
IV. New tab created when traces are loaded via PyMOL scripts Case 2: One trace Case 1: More than one trace Complex tab created after running a PyMOL script and opening the plugin. This tab is similar to Assembly. Tab created after running a PyMOL script and opening the plugin. This tab is similar to ET1. One chain loaded Three chains loaded PyMOL script: http://mammoth.bcm.tmc.edu/ETserver2/pdbeasytrace/pmlFiles/2phy.pml PyMOL script: http://mammoth.bcm.tmc.edu/ETserver2/pdbeasytrace/pmlFiles/1got.pml
V. Prismatic (Gobstopper) color ramp This box appears whenever Prismatic (Gobstopper) is selected as the display option for the currently selected top ET-ranked residues.
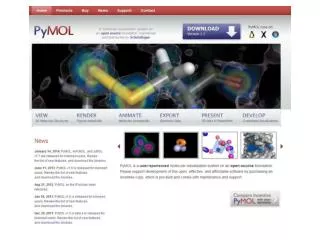
References • Warren L. DeLano "The PyMOL Molecular Graphics System." DeLano Scientific LLC, San Carlos, CA, USA. http://www.pymol.org; The PyMOL Molecular Graphics System, Version 1.2r3pre, Schrödinger, LLC • http://mammoth.bcm.tmc.edu/ETserver.html; Mihalek, I., I. Res, et al. (2006). "Evolutionary trace report_maker: a new type of service for comparative analysis of proteins." Bioinformatics22(13): 1656-7. • Mihalek, I., I. Res, et al. (2003). "Combining inference from evolution and geometric probability in protein structure evaluation." J Mol Biol331(1): 263-79. • Wilkins, A. D., R. Lua, et al. (2010). "Sequence and Structure Continuity of Evolutionary Importance Improves Protein Functional Site Discovery and Annotation." Protein Science • http://mammoth.bcm.tmc.edu/wiki/index.php/Zcoupling • Krissinel, E. and K. Henrick (2007). "Inference of macromolecular assemblies from crystalline state." J Mol Biol372(3): 774-97.