Download
1 / 1
10 likes | 130 Views
Evaluating Product Differentiation Strategies Via Multiple Product CVP Analysis: A Graphical Approach. David Marcinko, Skidmore College Raef Lawson, Institute of Management Accountants Saurav Dutta, University at Albany, SUNY.

E N D
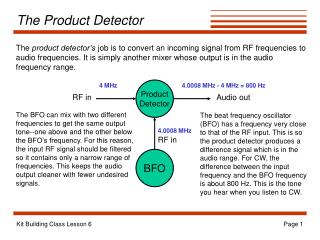
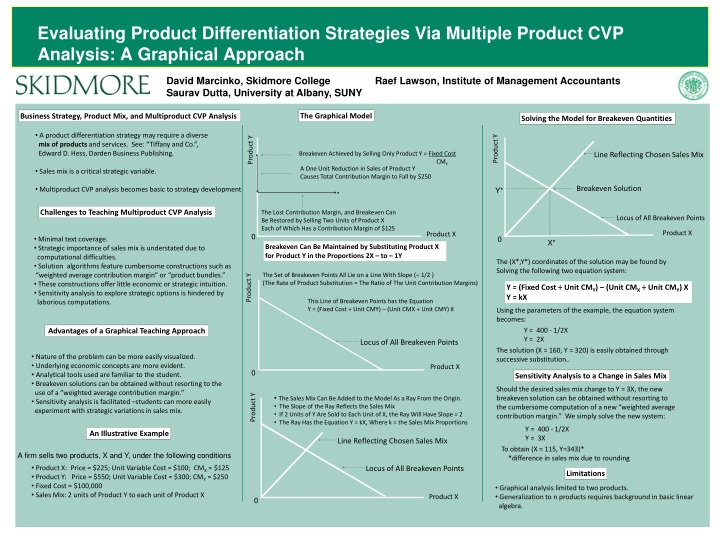
Evaluating Product Differentiation Strategies Via Multiple Product CVP Analysis: A Graphical Approach David Marcinko, Skidmore College Raef Lawson, Institute of Management Accountants Saurav Dutta, University at Albany, SUNY Business Strategy, Product Mix, and Multiproduct CVP Analysis The Graphical Model Solving the Model for Breakeven Quantities • A product differentiation strategy may require a diverse • mix of products and services. See: “Tiffany and Co.”, • Edward D. Hess, Darden Business Publishing. • Sales mix is a critical strategic variable. • Multiproduct CVP analysis becomes basic to strategy development . Product Y Product Y Breakeven Achieved by Selling Only Product Y = Fixed Cost CMY Line Reflecting Chosen Sales Mix A One Unit Reduction in Sales of Product Y Causes Total Contribution Margin to Fall by $250 . Breakeven Solution Y* Challenges to Teaching Multiproduct CVP Analysis The Lost Contribution Margin, and Breakeven Can Be Restored by Selling Two Units of Product X Each of Which Has a Contribution Margin of $125 Locus of All Breakeven Points Product X Product X 0 • Minimal text coverage. • Strategic importance of sales mix is understated due to • computational difficulties. • Solution algorithms feature cumbersome constructions such as • “weighted average contribution margin” or “product bundles.” • These constructions offer little economic or strategic intuition. • Sensitivity analysis to explore strategic options is hindered by • laborious computations. 0 X* Breakeven Can Be Maintained by Substituting Product X for Product Y in the Proportions 2X – to – 1Y The (X*,Y*) coordinates of the solution may be found by Solving the following two equation system: The Set of Breakeven Points All Lie on a Line With Slope (– 1/2 ) (The Rate of Product Substitution = The Ratio of The Unit Contribution Margins) Y = (Fixed Cost ÷ Unit CMY) – (Unit CMX ÷ Unit CMY) X Y = kX Product Y This Line of Breakeven Points has the Equation Y = (Fixed Cost ÷ Unit CMY) – (Unit CMX ÷ Unit CMY) X Using the parameters of the example, the equation system becomes: Advantages of a Graphical Teaching Approach Y = 400 - 1/2X Y = 2X Locus of All Breakeven Points The solution (X = 160, Y = 320) is easily obtained through successive substitution.. • Nature of the problem can be more easily visualized. • Underlying economic concepts are more evident. • Analytical tools used are familiar to the student. • Breakeven solutions can be obtained without resorting to the • use of a “weighted average contribution margin.” • Sensitivity analysis is facilitated –students can more easily • experiment with strategic variations in sales mix. Product X 0 Sensitivity Analysis to a Change in Sales Mix Should the desired sales mix change to Y = 3X, the new breakeven solution can be obtained without resorting to the cumbersome computation of a new “weighted average contribution margin.” We simply solve the new system: • The Sales Mix Can Be Added to the Model As a Ray From the Origin. • The Slope of the Ray Reflects the Sales Mix • If 2 Units of Y Are Sold to Each Unit of X, the Ray Will Have Slope = 2 • The Ray Has the Equation Y = kX, Where k = the Sales Mix Proportions Product Y Y = 400 - 1/2X Y = 3X An Illustrative Example Line Reflecting Chosen Sales Mix To obtain (X = 115, Y=343)* *difference in sales mix due to rounding A firm sells two products, X and Y, under the following conditions • Product X: Price = $225; Unit Variable Cost = $100; CMX = $125 • Product Y: Price = $550; Unit Variable Cost = $300; CMY = $250 • Fixed Cost = $100,000 • Sales Mix: 2 units of Product Y to each unit of Product X Locus of All Breakeven Points Limitations • Graphical analysis limited to two products. • Generalization to n products requires background in basic linear • algebra. Product X 0