Download

1 / 45
450 likes | 686 Views
The Family of Reliability Coefficients. Gregory G. Brown VASDHS/UCSD. Reliability Coefficients: The problems. Reliability coefficients were often developed in varying literatures without regard to a cohesive theory

E N D
The Family of Reliability Coefficients Gregory G. Brown VASDHS/UCSD
Reliability Coefficients: The problems • Reliability coefficients were often developed in varying literatures without regard to a cohesive theory • Cohesive theories of reliability available in the literature are not widely known • Reliability terms are used inconsistently • Different terms in the literature are at times used to represent the same reliability concept
Levels of the Family Tree Level 1. Study Aim Level 2. # Study Factors Level 3. # Levels within Study Factors Level 4. Score Standardization Level 5. Nesting Level 6. Level of Measurement
The Progenitor Coefficient Correlation Ratio (2) Winer et al., 1991
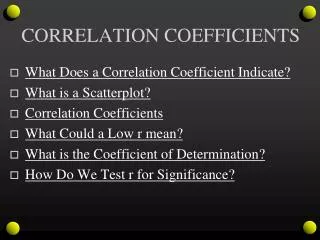
Correlation ratios • Vary between 0.0 and 1.0 • Typically measure the amount of variance accounted for by a factor in the analysis of variance design • Index the strength of association between levels of a study factor and the dependent variable, regardless of whether the functional relationship between study factors and the dependent measure is linear or nonlinear.
The two meanings of error • Definition 1: The error term in analysis of variance models: • Definition 2: All relevant sources of variance in an analysis of variance design besides the source of interest • The two definitions of error are associated with different reliability models and with different reliability coefficients
Levels of the Family Tree Level 1. Study Aim Correlation Ratio Determine Reliability Establish Validity Effect Size Measures Reliability Measures
Correlation Ratio and Reliability Measures Correlation ratios based on variance component estimates derived from random effects models are generally consistent measures of reliability (Olkin & Pratt, 1958).
The Correlation Ratio and Effect Size Measures Effect Size: Cohen’s Parameter related to power: Winer et al., 1991
Cohen’s f Cohen’s f is the variance of the means across the various levels of an study factor scaled by the common within group variance.
Caveat: There are Two Definitions of the Correlation Ratio • OLD Definition: The correlation ratio is a ratio of sums of squares (Kerlinger, 1964, pp. 200-206, Cohen, 1965). • Current Definition: The correlation ratio is a ratio of variance component estimates and their fixed effects analogues (eg. Winer et al., 1991). This is the definition of the correlation ratio used in this talk.
Correspondence Among Effect Size Measures + Cohen (1988); *Winer et al., 1991, pp. 120-133: F(2,57,f), p=.05
Shrout and Fleiss (1979) Example Entries are ratings on a scale of 1 to 10.
Correlation Ratios for Shrout and Fleiss Example: Random Effects Model For both Validity and Reliability Analyses Model: Xij=+i+j+ij i : effect of subject, N(0, ), i assumed to be independent of j and ij j : effect of raters, N(0, ), ti assumed to be Independent of i and ij Both i and j are random effects.
Results of Shrout and Fleiss Random Effects Analysis *Based on variance components estimates using total variance for denominator of correlation ratio. +Based on variance components definition of 2 and previously described relationship between 2 and Cohen’s f.
Claim 2 • The 2 for subjects equals the ICC(2,1) for these data (See Shrout and Fleiss, 1979). • Reliability and validity can both be investigated within an analysis of variance framework.
Levels of the Family Tree Level 1. Study Aim Level 2. # Study Factors
Levels of the Family Tree Level 2. Number of Study Factors Reliability Measures Single Factor Designs Multifactorial Designs Generalizability Theory Coefficients Intraclass Correlations
Examples • A single factor reliability design is one where there is only one only source of variance besides subjects (eg., Raters judging all subjects). • A multi-factor reliability design is one there are several sources of variance besides subjects (eg. Raters judging all subjects on 2 days).
Intraclass correlations for single facet reliability studies • Just reviewed by Lee Friedman
Generalizability Theory • Measurement always involves some conditions (eg. raters, items, ambient sound) that could be varied without changing the acceptability of the observations. • The experimental design defines a universe of acceptable observations of which a particular measurement is member. • The question of reliability resolves into the question of how accurately the observer can generalize back to the universe of observations.
Generalizability Theory (continued) • A reliable measure is one where the observed value closely estimates the expected score over all acceptable observations, i.e., the universe score • Generalizability coefficient: Cronback, Gleser, Nanda, & Rajaratnam, 1972
Basic Components of the Generalizability Coefficient • Universe score variance: the estimated variance across the objects of measurement (eg., people) in the sample at hand: • Relative error: For the Shrout & Fleiss example it is the sum of variance components related to people averaged over raters.
Generalizability Theory (continued) • Generalizability coefficient: Brennan, 2001
The Generalizability Coefficient • Generalizability Coefficient: • A large generalizability coefficient means that person variance can be estimated without large effects from other sources of variance that might effect the expected between-subject variation within raters.
Generalizability Theory and Measurement Precision • Generalizability Theory provides a measurement standard: True variation among objects of measurement, eg. people • Generalizability Theory uses the concept of person variance to provide a clear and simple relationship between reliability coefficients, C, and measurement precision: Standarderror = ((1-C)/C)2person.
Innovative Aspects of Generalizability Theory • Generalizability Theory asserts there exist multiple sources of error rather than the single error term of classical reliability theory. • Analysis of variance can be used to hunt these sources of error. • New definitions: • A reliability measure is one that is stable over unwanted sources of variance • A valid measure is one that varies over wanted sources of variance
Generalizability Coefficient for Shrout & Fleiss (1979) data
ICC(3,k) and the Generalizability Coefficient (continue) • The generalizability coefficient is equivalent to ICC(3,k) and both are measures of rater consistency • ICC(3,1) can be calculated directly from variance components estimates and is equal to the traditional use of the Correlation Ratio as a measure of amount of variance accounted for.
The Dependability Coefficient • Absolute error = sum of variance components each averaged over their respective numbers of observations • Depedendability coefficient =
The Dependability Coefficient and ICC(2,k) • The dependability coefficient of Generalizability Theory is equivalent to ICC(2,k) and both are measures of absolute agreement • ICC(2,1) can be calculated directly from variance components estimates and is equal to the traditional use of the Correlation Ratio as a measure of amount of variance accounted for.
Summary of Results of ICC and Generalizability Theory Comparisons *Values taken from Shrout & Fleiss, 1979 +Values calculated from GENOVA output
Intraclass and Generalizability Coefficients • Intraclass Correlation Coefficients are special cases of the one-facet generalizability study (Shrout & Fleiss, 1979) • The ICC(2,1), ICC(2,k), ICC(3,1), and ICC(3,k) intraclass correlations discussed by Shrout and Fleiss can be calculated from generalizability software (eg., Genova).
Levels of the Family Tree Level 1. Study Aim Level 2. # Study Factors Level 3. # Levels within Study Factors
Levels of the Family Tree Level 3. Number of Levels within Study Factors Generalizability Theory Coefficients Intraclass Coefficients Two Level Designs Multilevel Designs Two Level Designs Multilevel Designs Co-dependency Correlations Multilevel ICCs Historically no distinction made
Levels of the Family Tree Level 1. Study Aim Level 2. # Study Factors Level 3. # Levels within Study Factors Level 4. Score Standardization
Levels of the Family Tree Level 4. Score Standardization Co-dependency Measures Standardized Scores Raw or Partially Standardized Scores Pearson Product Moment Correlation Intraclass Correlations
Standardized Correlation Ratios Pearson Correlation = =
The Correlation Ratio and Pearson Produce Moment Correlation • When subject scores are standardized within rater, the Pearson Product Moment Correlation is equal to the Correlation ratio, when 2 is defined in terms of total variance • A generalized Product Moment Correlation can be defined across all raters simultaneously using the variance components calculated on standard scores Correlation Ratio (2)
Product Moment Correlations Variance components estimate (2) of rater 1 vs rater 3 reliability based on Z-scores = .7448
Multi-level Product Moment Correlation Calculated by standardizing scores within judges then calculating 2 using total variance components definition. For Shrout & Fleiss data this value = .7602 and represents global standardized consistency rating.
Conclusions • The concept of a correlation ratio relates effect size measures to reliability measures • ICCs are Generalizability Theory coefficients for single facet designs • ICC(3,1), ICC(3,k), and the Generalizability Coefficient are all measures of consistency • ICC(2,1), ICC(3,k), and the Dependability Coefficient are all measures of absolute agreement
Conclusions • The Pearson Product Moment Correlation is a single-facet, 2-level Correlation Ratio for standard scores and is, thus, a measure of consistency. • A multilevel Product Moment Correlation is a single-facet, k-level Correlaiton Ratio for standard scores and is a measure of standardized consistency across all raters.