Download
1 / 14
170 likes | 872 Views
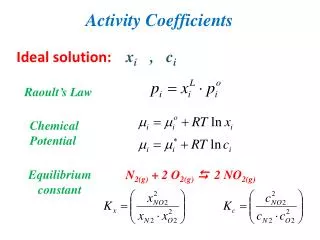
Standardized coefficients. Jane E. Miller, PhD. The Chicago Guide to Writing about Multivariate Analysis, 2 nd edition. Overview. Review of unstandardized coefficients Interpretation of standardized coefficients Descriptive statistics for multivariate models with standardized coefficients.

E N D
Standardized coefficients Jane E. Miller, PhD The Chicago Guide to Writing about Multivariate Analysis, 2nd edition.
Overview • Review of unstandardized coefficients • Interpretation of standardized coefficients • Descriptive statistics for multivariate models with standardized coefficients The Chicago Guide to Writing about Multivariate Analysis, 2nd edition.
Unstandardized coefficients • Unstandardizedβs estimate the effect of a 1-unit increase in Xi on Y, where the effect size is measured in the original units of Y. • A “one-size-fits-all” approach to interpreting βs can be misleading because variables • Represent different levels of measurement, • Have different units of measurement, • Have varying distributions of values, • Occur in different real-world circumstances.
Standardized coefficients • A standardized coefficient estimates the effect of a one-standard-deviation increase in Xi on Y • Measured in standard deviation units of Y • e.g., an effect size of 0.3 would mean 30% of a standard deviation in the dependent variable • Similar to standardized scores or z-scores • Standardized βs provide a consistent metric in which to compare the relative sizes of the βs on continuous independent variables with different ranges and scales. • Contrast for each IV is its standard deviation
Using standardized coefficients • Commonly used for psychological or attitudinal scales for which the units have no inherent meaning. • Should not be used for variables for which a one-standard-deviation increase lacks an intuitive interpretation. E.g., • dummy variables • interaction terms
Specifying a model with standardized coefficients • Easily specified as an option to an OLS model in most statistical packages. • Identify the dependent and independent variables as usual. • Enter them in the model specification in their original, untransformed versions. • Do not create versions in the metric of standard deviations. The software will do that for you! • Request “standardized betas”
Descriptive statistics to report if you use standardized coefficients • In table of descriptive statistics, report the mean, minimum and maximum values and standard deviation in the original units for • each independent variable (IV) • the dependent variable (DV)
Describing standardized coefficients in prose • In the results section, interpret the effect sizes for different IVs in terms of multiples or percentages of the standard deviation in the DV • E.g., “A one-standard-deviation increase in the income-to-poverty ratio (IPR) is associated with an increase of 19.6% of a standard deviation in birth weight (about 38 grams), roughly twice the size of the corresponding standardized coefficient on mother’s age (9.7%).”
Reporting the effect size in original units “A one-standard-deviation increase in the income-to-poverty ratio (IPR) is associated with an increase of 19.6% of a standard deviation in birth weight (about 38 grams), roughly twice the size of the corresponding standardized coefficient on mother’s age (9.7%).” • Note that the effect size is also reported back in the original units of the DV (grams in this case), to facilitate intuitive understanding in the context of the specific research question and variables.
Summary • Consider whether standardized coefficients fit your topic and data • Continuous variables • Field or discipline • Report descriptive statistics in original units to facilitate real-world interpretation of effect sizes. • Clearly convey the units in which the standardized coefficients are measured.
Suggested resources • Miller, J. E., 2013. The Chicago Guide to Writing about Multivariate Analysis, 2nd Edition. • Chapter 8, on standardized scores and z-scores • Chapter 10, on standardized coefficients • Kachigan, Sam Kash. 1991. Multivariate Statistical Analysis: A Conceptual Introduction. 2nd Edition. New York: Radius Press.
Supplemental online resources • Podcasts on • Interpreting multivariate coefficients • Defining the Goldilocks problem • Resolving the Goldilocks problem using model specification
Suggested practice exercises • Study guide to The Chicago Guide to Writing about Multivariate Analysis, 2nd Edition. • Questions #5 through 8 from the problem set for chapter 10 • Suggested course extensions for chapter 10 • “Reviewing” exercise #3. • “Applying statistics and writing” question #5. • “Revising” questions #8 and 9.
Contact information Jane E. Miller, PhD jmiller@ifh.rutgers.edu Online materials available at http://press.uchicago.edu/books/miller/multivariate/index.html The Chicago Guide to Writing about Multivariate Analysis, 2nd edition.