Download
1 / 16
330 likes | 813 Views
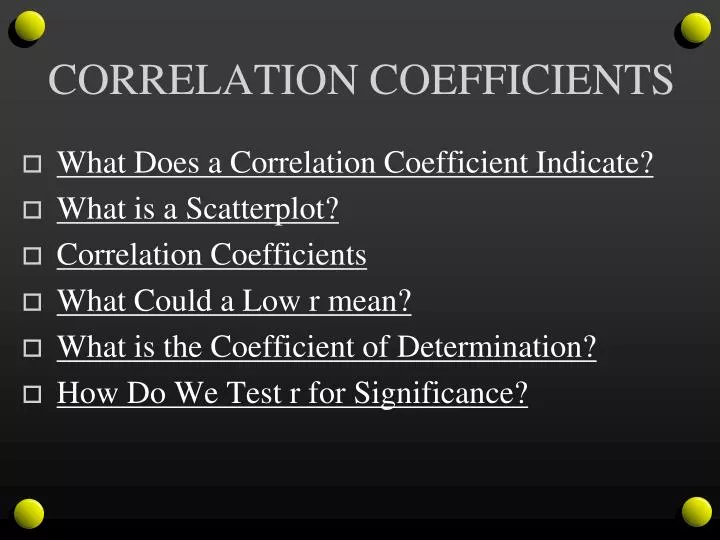
CORRELATION COEFFICIENTS. What Does a Correlation Coefficient Indicate? What is a Scatterplot ? Correlation Coefficients What Could a Low r mean? What is the Coefficient of Determination ? How Do We Test r for Significance?. What Does a Correlation Coefficient Indicate?.

E N D
CORRELATION COEFFICIENTS • What Does a Correlation Coefficient Indicate? • What is a Scatterplot? • Correlation Coefficients • What Could a Low r mean? • What is the Coefficient of Determination? • How Do We Test r for Significance?
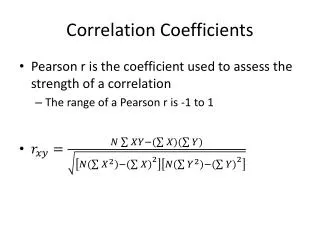
What Does a Correlation Coefficient Indicate? • Strength of relationship • 0 means no relationship at all • -1 or +1 means perfectly related • Direction of relationship • positive: variable X increases as variable Y increases • negative: variable X decreases as variable Y increases
What is a Scatterplot? • A correlation is graphically displayed using a scatterplot. • The scatterplot is a graph with one variable on each axis, and a mark for each individual measured. • Scatterplots are useful for estimating the direction, strength, and nature of the relationship.
high positive r o o o o o o o Y o o o o o o o o o o o o o o o o o o o o low high X
high o o o negative r o o o Y o o o o o o o o o o o o o o o o o o o o o low high X
high o o o o zero r o o o o o o Y o o o o o o o o o o o o o o o o o low high X
Non-linear relationship high o o o o o o o o o o o o Y o o o o o o o o o o o o o o o low high X
Correlation Coefficients X data Y data Coefficient interval/ratio interval/ratio Pearson r ordinal ordinal Spearman rho dichotomous interval/ratio Point Biserial dichotomous dichotomous Phi dichotomous: having only two values
More on Dichotomous Variables • With dichotomous variables, whether r is negative or positive depends on how the numbers were assigned
More on Dichotomous Variables • If the correlation between gender and GPA is positive, it could mean that • females have higher GPAs, if males were 1’s and females were 2’s • males have higher GPAs, if females were 1’s and males were 2’s
What Could a Low r Mean? • Lack of a relationship. • Unreliable measurement. • Non-linear relationship. • Restricted range : full range of scores not measured on both variables
What is the Coefficient of Determination? • Measure of proportion of explained variance in Y based on X. • Square r to get r2. Example: r = .36 r2 = .13 We can explain 13% of the differences in Exam 2 scores by knowing Exam 1 scores.
How Do We Test r for Significance? • Any test of significance requires assumptions for the test to be valid. • For a correlation coefficient, the assumptions are: • appropriate measurement scales for correlation coefficient • independent pairs of scores • normally distributed variables • if a relationship exists, it is linear
How Do We Test r for Significance? • Decide whether to do a one-tailed or two-tailed test. • One-tailed: directional hypothesis (positive r or negative r) • Two tailed: nondirectional hypothesis • It is always safe to do a two-tailed test.
How Do We Test r for Significance? • Determine the alpha level. The conventional level is .05. • Determine the degrees of freedom (df), which affects the shape of the sample distribution. For r, the df = N-2.
How Do We Test r for Significance? • When computing by hand, find the critical value of r in an r table. If the calculated r beats the critical value, the result is significant. • When using computer software, look for the significance level of r. If the significance level is smaller than your alpha level, the result is significant.