Download
1 / 14
140 likes | 302 Views
Survey Results Snapshot. A Quick Scan Activity to begin looking at your school’s data results . Allocate 30-45 minutes for completion. Survey Results Snapshot. Designed for educators with limited time to capture a quick initial scan of their teaching conditions

E N D
Survey Results Snapshot A Quick Scan Activity to begin looking at your school’s data results Allocate 30-45 minutes for completion
Survey Results Snapshot • Designed for educators with limited time to capture a quick initial scan of their teaching conditions • By the end of this session, participants will have: • Examined the summary results of the Survey • Identified specific teaching conditions that exceed or fall short of district averages • Considered specific areas for closer examination • Explored Individual Item prompts to begin collaborative discussion of identified areas
Keep In Mind • Teaching conditions are complex and take time to address • This training is designed only to begin conversations about the presence of positive teaching conditions in your school • Not intended to represent the entirety of staff development for improving school conditions • For a more comprehensive process for exploring your teaching conditions over time, please examine other resources located in the ‘Tools’ section of the survey website
Materials You Will Need • A printout copy of your school’s survey summary results • Locate your school’s summary report on the survey website by clicking on this icon: • Will be about 6 pages in printed length • A writing implement, preferably two of different colors • Internet access
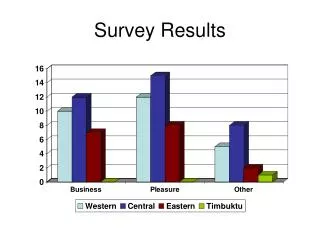
On the summary report, each of the columns represents a different group of schools and the percentage of educators that either agree or strongly agree with the condition examined Your Your Similar Your State District Level School
The different columns of data • District: Numbers in the ‘district’ column are educators from all grade levels (elementary, middle, and high) across your district averaged together • Level: All educators across the entire district working in a school of similar grade level to your own school averaged together (elementary, middle, or high) • School: All the educators in your school that participated in the survey averaged together
Directions • Examine questions related to the construct of Time first • Compare your school’s agreement on each question with that of the district average • Circle in one color the items where your school is above the districtaverage by more than 3% Circle in a different color the items where your school is below the districtaverage by more than 3% Your Your Similar Your State District Level School 60.2%
Directions • If you don’t have different colored pens, consider using shapes Your Your Similar Your State District Level School 60.2%
Directions • Review the highlighted questions and make an additional mark next to the two questions with the greatest positive and negative differences between your school and the district Your Your Similar Your State District Level School 60.2%
Directions • Repeat this analysis for each of the construct areas • This process quickly identifies the most positively viewed conditions and the most challenging conditions your educators perceive relative to the district average
For those specific conditions your educators identified as more positive than the district: • Reflect on specific policies/activities/decisions you and your colleagues made that might have enabled these particular conditions to thrive • Consider different ways you might celebrate some or all of these findings with your staff, parents, and/or the community • Explore how the enabling characteristics of your policies/activities/decisions in these areas may be expanded to support school improvement planning for other aspects of your teaching conditions
For those specific conditions your educators identified as more challenging than the district: • Reflect on existing policies/activities/decisions in place in your school which may be contributing to these conditions • Explore ways you can engage your school colleagues about these conditions and consider ways for school improvement
A Next Step • Survey results are a valuable initial marker of how educators view their teaching conditions • To get a more detailed and holistic perspective of conditions and the factors that contribute to them, collaborative discussions with educators across the school are critical for school improvement planning • To support productive, efficient initial conversations, a series of individual item prompts for most of the conditions explored in the survey are available in the ‘tools’ portion of the website
Some tips for successful collaboration • Establish some conversational norms to protect the safety of all participants and keep conversations focused on the topic • Assign a recorder to capture emerging thoughts and ideas in the room • Limit your improvement planning to only one or two conditions to maximize your effort • Be inclusive in the collaborative process. Work to capture as many educators voices as possible • Allocate time for follow up and school improvement planning