Download
1 / 31
310 likes | 421 Views
Survey Results. 2007 ASTD Cascadia Chapter Regional Conference. 2007 Conference Survey Results. Response Rate Demographics Conference Participants Breakout Sessions Speakers Volunteers Exhibitors Sponsors. 2005/2007 Response Rates. Response Rate Increase from 2005 to 2007.

E N D
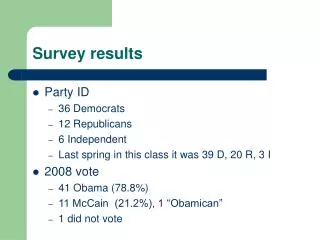
Survey Results 2007 ASTD Cascadia Chapter Regional Conference
2007 Conference Survey Results • Response Rate • Demographics • Conference Participants • Breakout Sessions • Speakers • Volunteers • Exhibitors • Sponsors
181 responded 9 skipped Counts by Industry
183 responded 7 skipped Counts by Professional Role
183 responded 7 skipped Count of Responses Years in TD Field
If Participant had Attended Previously, Which Year(s) Count of Participants Indicating Previous Attendance 181 responded 9 skipped 54 responded 136 skipped 2004 23 YES 53 2005 47 NO128 Count of Responses Participant Prior Attendance
Average Conference Ratings 179 responded 11 skipped Rating Scale 1-5
How Did Participants Hear about the Conference? 172 responded 18 skipped Friend/Colleague (52) Other (88) (ASTD Cascadia email) Workplace (37) Yahoo Listserv (4) Portland Business Journal (1) State Training Group (4)
Will Participant Attend the Next Conference? 175 responded 15 skipped NO (10) YES (93) UNSURE (72)
Average Ratings for Keynote Speakers by Participants Jean Lipman-Blumen JanetBennett MarcRosenberg Rating Scale 1-5 172 responded 18 skipped 149 responded 41 skipped 165 responded 25 skipped
Participant Data Follow this link to view detailed participant data: 2007 Conference Surveys and Charts-no comments.xls 2007_Conference_Pivot_Table.xls
Participant Comments Follow this link to view participant comments: 2007 Conference Participant Comments.doc
Breakout Sessions Breakout session analysis is available in Excel format. Follow this link to view the Excel file: 2007_Breakout_Sessions_Pivot.xls BreakOut_Session_Comments.pdf
Speaker’s Ratings of Conference Experience 12 speakers responded
Speaker Comments Follow this link to view speaker comments: 2007 Conference Speaker Survey Comments.doc
Ratings of Volunteer Experience 10 of 24 volunteers responded
Volunteer Comments Follow this link to view volunteer comments: 2007 Conference Volunteer Survey Comments.doc
Exhibitor Comments Follow this link to view exhibitor comments: 2007 Conference Exhibitor Comments.doc
Suggestions for Next Evaluation • Continue to use paper and web surveys • Send email with link to surveys within 24 hours of the close of the conference • Use an incentive to return surveys (like the iPod drawing) • Include a listing in the program of changes made as a result of participant comments. • Tweak survey questions
Suggestions for Next Conf • Sound checks in main conf. room • Food between sessions • More sponsors (LMS) • Better signage