Download
1 / 20
200 likes | 340 Views
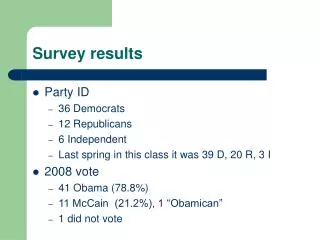
Survey Results. Youth Parliament of Manitoba Inc. What Survey?. YPM Inc. conducted a survey back in late January. The survey was sent out in several emails. Responses were collected throughout late January and the early part of February. Survey Format.

E N D
Survey Results Youth Parliament of Manitoba Inc.
What Survey?.... • YPM Inc. conducted a survey back in late January. • The survey was sent out in several emails. • Responses were collected throughout late January and the early part of February.
Survey Format • The survey used a ratings system from 0 to 4 • The survey asked both qualitative and quantitative questions regarding virtually all aspects of session. • Some questions also addressed aspects of YP outside of session.
The Response! • 40 members responded to the survey • That is nearly 2/3 of our entire membership!!!
Food Conclusions • Generally speaking, members seemed to prefer the food prepared at the school over the food offered at the Old Spaghetti Factory.
Merchandise • 70 % of respondents bought merchandise • Neat Fact: Rural respondents gave higher ratings, in all respects, than urban respondents
The A.C.R.O.N.Y.M • Readership – 97.5% • (Females 100%; Males 94.1%) • 40% of respondents contributed to the ACRONYM
Legislation • Amendments: 82.9% of respondents participated • Neat Fact: 100% of new respondents participated
Events & Timings • 81.4 % of respondents reported being woken up on time… • …only 50 % of twenty year olds reported being woken up on time…
E & T cont. • On average: • Respondents wanted less time for the following activities: • Speaker’s Hour, Alumni Event, Alumni Reception, Roundtable, Clerk’s Message, Party Luncheons, Committees, Executive Elections. • Respondents wanted more time for the following activities: • YP Orientation, Question Period, Debate, Cabinet Take-Over, Free Time for Supper & at the School, Sleeping
E & T cont. • 88% of respondents felt that they had adequate information prior to an event taking place. • 99% of respondents felt that they were adequately recognized to speak.
General • 86.5% of respondents felt that they had adequate information about Session prior to Session. • At 58.3%, backbenchers felt the least informed prior to session. • All respondents found the registration fee to be reasonable. • 91.2% reported that they would consider attending the following Session. • 78.8% would consider applying for Cabinet.
The End… …until the next survey that is…