Download
1 / 21
220 likes | 1.03k Views
Z Scores & Correlation. Greg C Elvers. Z Scores. A z score is a way of standardizing the scale of two distributions When the scales have been standardize, it is easier to compare scores on one distribution to scores on the other distribution. An Example.

E N D
Z Scores & Correlation Greg C Elvers
Z Scores • A z score is a way of standardizing the scale of two distributions • When the scales have been standardize, it is easier to compare scores on one distribution to scores on the other distribution
An Example • You scored 80 on exam 1 and 75 on exam 2. On which exam did you do better? • The answer may or may not be that you did better on exam 2 • In order to decide on which exam you did better, you must also know the mean and standard deviation of the exams
An Example • The mean and standard deviation of Exam 1 were 85 and 5, respectively • The mean and standard deviation of Exam 2 were 70 and 5, respectively • So, you scored below the mean on exam 1 and above the mean on exam 2 • On which exam did you do better?
Z Scores • A z score is defined as the deviate score (the observed score minus the mean) divided by the standard deviation • It tells us how far a score is from the mean in units of the standard deviation
An Example • You have a z score of -1 on the first exam • Your score was one standard deviation below the mean on exam 1 • You have a z score of 1 on the second exam • Your score was one standard deviation above the mean on exam 2 • You did better on exam 2
Important Properties of Z Scores • The mean of a distribution of z scores is always 0 • The standard deviation of a distribution of z scores is always 1 • The sum of the squared z scores always equals N
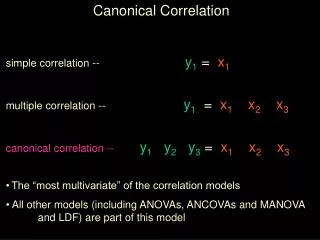
Z scores and Pearson’s r • Pearson’s r is defined as:
What the Formula Means • The z scores in the formula simply standardize the unit of measure in both distributions • The product of the z scores is maximized when the largest zx is paired with the largest zy
r = 1 • Because of the unit standardization, when there is a perfect correlation zx = zy • Then zxzy = zx2 = zy2
r = 0 • When r = 0, large zx can be paired with large or small zy • Furthermore, positive zx can be paired with either positive or negative zy • The sum of zxzy will tend to 0 • Thus, r will tend to 0
Coefficient of Determination • The coefficient of determination is the proportion of variance in one variable that is explainable by variation in the other variable • It tells us how well we can predict the value of one variable given the value of another
Coefficient of Determination • When there is a perfect correlation between two variables, then all the variation in one variable can be explained by variation in the other variable • Thus the coefficient of determination must equal 1
Coefficient of Determination • When there is no relation between two variables, then none of the variation in one variable can be explained by variation in the other variable • Thus the coefficient of determination must equal 0
Coefficient of Determination • The coefficient of determination is defined as r2 • When r = 1 or r = -1, r2 = 1, as it should be • When r = 0, r2 = 0, as it should be
Coefficient of Nondetermination • The coefficient of nondetermination is the amount of variation in one variable that is not explainable by the variation in the other variable • The coefficient of nondetermination equals (1 - r2)
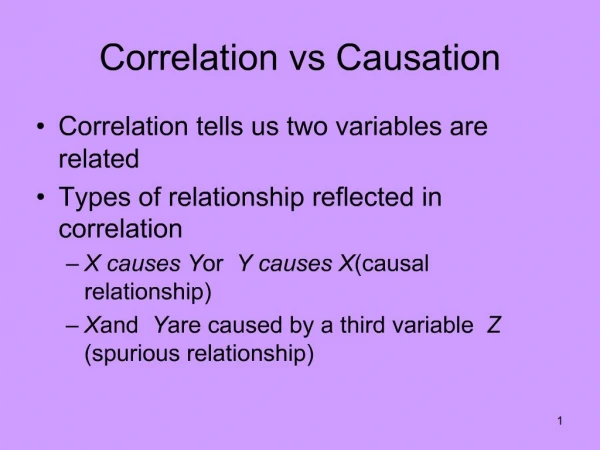
Correlation and Causation • Correlation does not show causation • Just because two variables are correlated (even perfectly correlated) does not imply that changes in one variable cause the changes in the other variable • E.g., even if drinking and GPA are correlated, we do not know if people drink more because their GPA is low (drink to alleviate stress) or if drinking causes one’s GPA to be low (less study time) or neither of these
Correlation and Causation • There is always a chance that the variation in both variables is due to the variation in some third variable • r = 0.95 for number of storks sighted in Oldenburg Germany and the population of Oldenburg from 1930 to 1936 • Storks do not cause babies • Babies do not cause storks • What is the third variable that causes both?