Download
1 / 13
140 likes | 392 Views
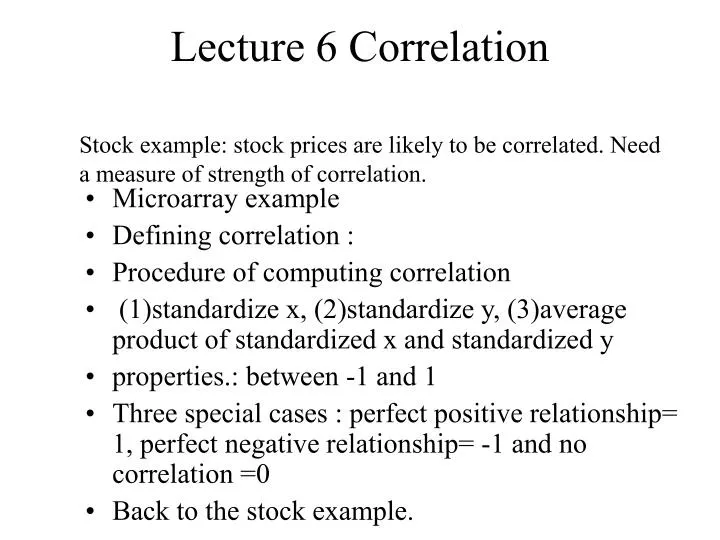
Lecture 6 Correlation. Stock example: stock prices are likely to be correlated. Need a measure of strength of correlation. Microarray example Defining correlation : Procedure of computing correlation (1)standardize x, (2)standardize y, (3)average product of standardized x and standardized y

E N D
Lecture 6 Correlation Stock example: stock prices are likely to be correlated. Need a measure of strength of correlation. • Microarray example • Defining correlation : • Procedure of computing correlation • (1)standardize x, (2)standardize y, (3)average product of standardized x and standardized y • properties.: between -1 and 1 • Three special cases : perfect positive relationship= 1, perfect negative relationship= -1 and no correlation =0 • Back to the stock example.
Definition of correlation coefficient Correlation remains the same under any scale changes If X and Y both have mean 0 and variance 1, then correlation coefficient r = E (XY) For the general case, standardize each variable first. If you forgot to divide by SD, then you obtained a quantity called Covariance, which is still useful (see next page) Cov (X, Y) = E (X-mean of X)(Y-mean of Y) Without subtracting the mean, you got E(XY), a garbage ! A remedy : cov(X,Y) = E(XY) - E(X) E(Y)
Correlation coefficient= cov(X,Y)/SD(X)SD(Y), wherecov(X,Y)= E [(X-mean) (Y-mean)] • Use the independence example (from lecture 4) to construct positive correlation by cutting of the points on the edge • Do a step by step calculation of corr. Coeff. • Do a plotting showing 4 quadrants by drawing vertical and horizontal lines passing the means.
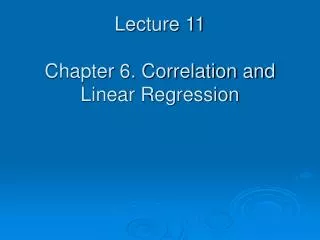
Product=negative Product=positive (-, +) X lower than mean Y higher than mean (+, +) X, Y both higher than mean (+, -) X higher than mean, Y lower than mean (-, -) X,Y both lower than mean Product=negative Product=positive
Consistency : if use n-1 in doing SD, then use n-1 for averaging product Conceptual : Step by step for Corr Coeff.Stdzd = standardized (remove mean, divided by SD) X-EX Y-EY -1.5 -2.5 0.5 -0.5 2.5 1.5 -5 -3 -1 1 3 5 Corr=(29/6)/3.4 times 1.7=29/35=0.828 E X=7 E Y=5.5 SD( X) =sqrt(35/3)=3.4 SD(Y)=1.7 Use population version, so divided by n
Consistency : if use n-1 in doing SD, then use n-1 for averaging product Practice: Step by step for Covariance,variance, and correlation coefficients. Cov =29/6 SD( X) =3.4 sqrt(35/3)=3.4 SD(Y)=1.7 Corr=0.828 =cov/sd(x)sd(y) E X=7 E Y=5.5 Use population version, so divided by n
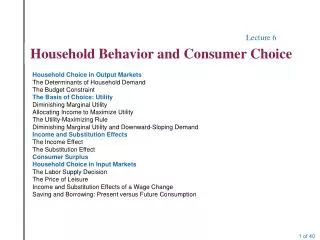
Positive correlations • Corr = 0.9 • Corr =.8 • Corr = .5 On line illustration with Xlispstat, using (bi-normal r n)
Algebra for Variance, covariance • Var(X+Y)= Var X + Var Y + 2 cov (X,Y) • Var(X) = Cov (X, X) • Var (X+a)= Var (X) • Cov (X+a, Y+ b)= Cov(X,Y) • Cov (aX, bY)=ab Cov(X,Y) • Var(aX) =a2 Var (X) • Cov( X+Y, Z)= cov(X,Z) + cov (Y,Z) • Cov (X+Y, V+W)= cov(X,V) + cov (X, W) + cov (Y, W) + cov(Y,W) TRICK : pretend all means are zero; (X+Y)(V+W)=XV+XW+YW+YW
Stock prices are correlated • Effect on variance of option 1 and option • Recall the problem
Example • Stock A and Stock B • Current price : both the same, $10 per share • Predicted performance a week later: similar • Both following a normal distribution with • Mean $10.0 and SD $1.0 • You have twenty dollars to invest • Option 1 : buy 2 shares of A portfolio mean=?, SD=? • Option 2 : buy one share of A and one share of B • Which one is better? Why? Assume that there is a correlation of .8 between the prices of stock A and stock B a week later
Better? In what sense? • What is the probability that portfolio value will be higher than 22 ? • What is the probability that portfolio value will be lower than 18? • What is the probability that portfolio value will be between18 and 22? (How about if correlation equals 1 ?)
For option 2, the key is to find variance • Let X be the future price of stock A • Let Y be the future price of stock B • Let T = X + Y portfolio value • E T = E X + E Y (same as done before) • Var T = Var X + Var Y + 2 cov (X, Y) • Cov (X, Y) = correlation times SD(X) SD(Y) = .8 times 1 times 1 = 0.8 • Var X = (SD (X) )2=12=1; Var Y = 1 • Var T = 1 + 1 + 2 times .8 = 3.6 (compared to 1+1=2 when assuming independence) SD (T) = squared root of 3.6=1.9 is still less than SD for option 1
Index • Index is usually constructed as a weighted average of several variables • Stock index • Course grade = .2 midterm+ .45 Final + .15 HW + .2 LAB • Find SD of course grade • Independence; dependence