Download
1 / 23
230 likes | 334 Views
Microarrays. Dr Peter Smooker, peter.smooker@rmit.edu.au. Transcription Analysis. An analysis of transcription rates can be used to inform us about the activity of a gene- it’s expression levels, the tissues it is expressed in, developmental expression etc.

E N D
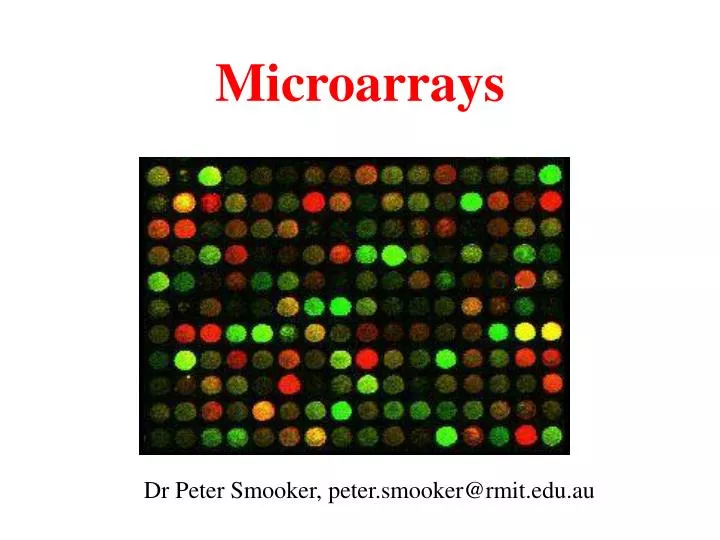
Microarrays Dr Peter Smooker, peter.smooker@rmit.edu.au
Transcription Analysis • An analysis of transcription rates can be used to inform us about the activity of a gene- it’s expression levels, the tissues it is expressed in, developmental expression etc. • Traditionally, this was done on a gene-by-gene basis, as the sequence of that particular gene was identified (used as a probe). This was done using Northern Blotting (semi-quantitative).
Developments • As in almost every field of molecular biology, PCR revolutionised transcript analysis. However, still done on a gene-by-gene basis. • Genome sequencing projects. These generated a large number of gene probes that can be used to analyse global transcription.
Global transcript analysis • Theoretically, every gene can be arrayed and transcription levels analyses. • Often, a subset is used e.g. immune response genes.
Microarrays are a discovery technique • Understanding the genes/proteins involved in disease • Bottom up approach- single genes are analysed. What does this gene encode? What does the product do? Are defects in the product involved in disease? • Top down approach. Identify all genes whose expression is altered in a particular disease state. Identify an expression profile.
Microarrays- basic theory • Spot DNA sequences (genes) onto a chip • Extract RNA from samples to be analysed • Convert to cDNA using reverse transcriptase • Hybridise to chip • Quantify hybridisation
Cy5 Cy3
Discovery…. • Microarrays used to detect yeast genes regulated in sporulation • More than 1000 found (many previously unknown) • Several mutated and phenotype observed- all strains were defective in sporulation • Discover function by observing expression
Some applications • Identify and validate drug targets • Gene expression in pathogens • Population genetics • Disease prognosis • etc. etc.
Fabricating arrays • The spots on the array are generally oligonucleotides or PCR-generated cDNA. These are arrayed using a robotic arm. • For RNA expression analysis, glass slides are used. • Up to 10,000 per slide
Oligonucleotide arrays • Up to 300,0000 oligonucleotides per slide Approx. 10 per gene
Scanning • After hybridisation of the labelled RNA, the slide is scanned. • A laser excites each spot. The Cy3 and Cy5 dyes emit fluorescence, which is captures by a confocal microscope. The classic array picture is generated (for human perusal).
Data Analysis • The fluorescence of Cy3 and Cy5 is registered for each spot, normalised and a ratio between the two calculated. • Trivially, greater than 2-fold differences are seen as significant. • Often calculate SD and use that as a measure of significance. • As the genes that are often the most interesting are expressed in low abundance, normalisation and statistics is important.
Expression profile clustering Cluster genes that give the same expression pattern over several experiments/conditions. Construct a matrix. Each column is an experiment, each row a gene.
Clustering • Clustering is the division of the elements of a set into subsets, by virtue of a distance metric among the elements • From a biological perspective, this might mean clustering all genes that have elevated transcription in tamoxifen-resistant breast cancer
Clustering • Some clustering techniques include: • Hierarchical clustering • Self-organising maps • K-means clustering • SVM • Because the elements in a cluster are assigned a distance, phylogenetic techniques can be used to determine relationships. Traditional phylogenetic tools are used (e.g. Phylip)
Cancer profiles • One area of research is the profiling of tumours. The expression pattern of each tumour is compared, and the clinical history of the patient is also known. This can lead to diagnostic predictions.
An Example Breast Cancer Res. 2001; 3 (2): 77–80Molecular profiling of breast cancer: portraits but not physiognomy James D. Brenton, 1 Samuel A. J. R. Aparicio,2 and Carlos Caldas2
Breast cancers may have different outcomes despite similar histopathological appearance. • Want to identify key prognostic markers. • Used 84 arrays, total over 680,000 data points. Tested 65 samples.
Used hierarchical clustering to reveal groups with similar patterns of gene expression.