Download

1 / 61
630 likes | 893 Views
Microarrays. OUTLINE. Microarrays Processing Microarray Data K- Means Clustering Hierarchical Clustering SOM. Microarrays. Gene Expression: We see difference between cels because of differential gene expression , Gene is expressed by transcribing DNA intosingle-stranded mRNA,

E N D
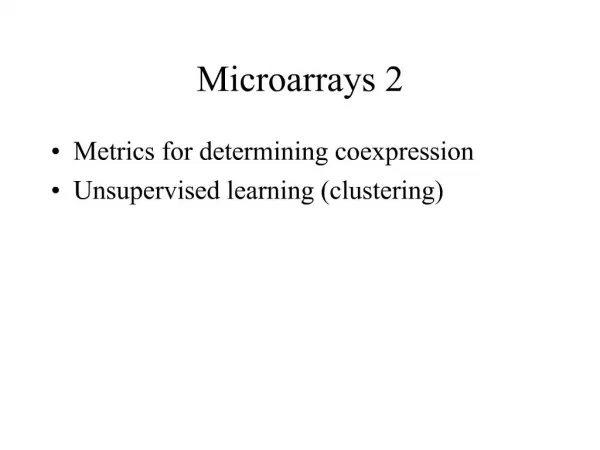
OUTLINE • Microarrays • Processing Microarray Data • K- Means Clustering • Hierarchical Clustering • SOM
Microarrays Gene Expression: We see difference between cels because of differential gene expression, Gene is expressed by transcribing DNA intosingle-stranded mRNA, mRNA is later translated into a protein, Microarrays measure the level of mRNA expression
Microarrays Gene Expression: mRNA expression represents dynamic aspects of cell, mRNA is isolated and labeled using a fluorescent material, mRNA is hybridized to the target; level of hybridization corresponds to light emission which is measured with a laser
Microarrays Animation (by A. Malcolm Campbell): http://www.bio.davidson.edu/Courses/genomics/chip/chip.html
Microarrays Sample Application (oncotypeDX): http://www.oncotypedx.com/en-US/Breast.aspx
Microarrays Sample Application (oncotypeDX): VIDEO http://www.oncotypedx.com/en-US/Breast.aspx
Processing Microarray Data Problems: Extract data from microarrays, Analyze the meaning of the multiple arrays.
Processing Microarray Data Differentiating gene expression: R = G not differentiated R > G up-regulated R < G down regulated
Processing Microarray Data Problems: Extract data from microarrays, Analyze the meaning of the multiple arrays.
Processing Microarray Data Characteristics of microarray data: Experiment = (gene1, gene2,…, geneN ) Gene = (experiment1, experiment2, …, experimentM) N is often on the order of 104 M is often on the order of 101
Processing Microarray Data Microarray data:
Processing Microarray Data Data Analysis: Clustering: What genes have similar functions, Subdivide genes or experiments into meaningful classes. Classification: Can we correctly classify an unknown experiment or gene into a known class? FOR EXAMPLE: Can we make better treatment decisions for a cancer patient based on gene expression profile?
Processing Microarray Data Clustering: Find classes in the data, Identify new classes, Identify gene correlations, Methods: K-means clustering, Hierarchical clustering, Self Organizing Maps (SOM)
Processing Microarray Data Distance Measures: Euclidean Distance: Manhattan Distance:
Processing Microarray Data K-means Clustering: Break the data into K clusters, Start with random partitioning, Improve it by iterating.
Processing Microarray Data K-means Clustering: Select # of clusters, say k, Repeat Select k random centroids, {m1, m2,…, mk}, Assign points (genes in this case) to the cluster of closest centroid by using a distance measure, Compute new centroids, {m1, m2,…, mk}, until no change to any centroid.
Processing Microarray Data K-means Clustering:
Processing Microarray Data K-means Clustering: Select # of clusters, say k, Therea are some methods to determine the optimum k, Assume k is given.
Processing Microarray Data K-means Clustering: Select k random centroids, {m1, m2,…, mk}, Just randomly assign the centroids.
Processing Microarray Data K-means Clustering: Assign points (genes in this case) to the cluster of closest centroid by using a distance measure, Use the following formula to find the closest centroid to the gene gi: Then assign gene gi to the closest centroid.
Processing Microarray Data K-means Clustering: Compute new centroids, {m1, m2,…, mk}, Find the average in the cluster: Where: mc: centroid of the cluster c, Nc: the number of points in cluster c, gi: the points in cluster c.
Processing Microarray Data K-means Clustering: Repeat until no change to any centroid. Centroids are in the proper places, We can not observe any other improvement in centroids, Therefore STOP.
Processing Microarray Data K-means Clustering DEMO: Our points:
Processing Microarray Data K-means Clustering DEMO: Centroids (4 centroids, squares):
Processing Microarray Data K-means Clustering DEMO: Assign each point to the closest centroid:
Processing Microarray Data K-means Clustering DEMO: Re evaluate the centroids:
Processing Microarray Data K-means Clustering DEMO: Iterate until no change.
Processing Microarray Data K-means Clustering DEMO 2:
Processing Microarray Data Hierarchical Clustering: Similar to costruction of phylogenetic tree, A distance matrix for all genes are constructed based on distances between their expression profiles. Neighbor-joining or UPGMA can be applied on this matrix to get a hierarchical cluster. Single linkage, complete linkage, average linkage clustering
Processing Microarray Data Hierarchical Clustering: Single linkage: the distance between two clusters is given by the value of the shortest link between the clusters
Processing Microarray Data Hierarchical Clustering: Complete linkage: the distance between two clusters is given by the value of the longest link between the clusters
Processing Microarray Data Hierarchical Clustering: Average linkage: the distance between two clusters is defined as the average of distances between all pairs of objects like UPGMA
Processing Microarray Data Hierarchical Clustering: Linkage Criteria:
Processing Microarray Data Agglomerative Hierarchical Clustering:
Processing Microarray Data Agglomerative Hierarchical Clustering:
Processing Microarray Data Agglomerative Hierarchical Clustering DEMO:
Processing Microarray Data Agglomerative Hierarchical Clustering DEMO:
Processing Microarray Data Agglomerative Hierarchical Clustering DEMO:
Processing Microarray Data Agglomerative Hierarchical Clustering DEMO:
Processing Microarray Data Agglomerative Hierarchical Clustering DEMO:
Processing Microarray Data Agglomerative Hierarchical Clustering DEMO:
Processing Microarray Data Agglomerative Hierarchical Clustering DEMO:
Processing Microarray Data Agglomerative Hierarchical Clustering:
Processing Microarray Data Agglomerative Hierarchical Clustering: