Download
1 / 18
180 likes | 181 Views
Explore the concept of ratio tables and how they can be used to create graphs. Learn how equivalent ratios can be represented on the coordinate plane. Practice completing ratio tables and graphing the corresponding ordered pairs.

E N D
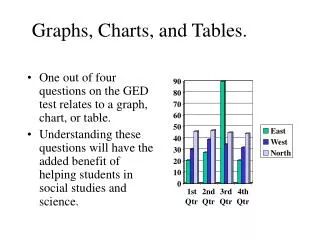
Graph Ratio Tables MCGE: RP.3 EQ: How can we relate ratios to tables and graphs?
Activator: Give One Get One Partner 1: Give Partner 2 one fact that you recall about ratio tables. Partner 2: Give Partner 1 one fact that you recall about ratio tables.
Mini-lesson Tool: Ratio Tables Equivalent Ratios express the same relationship between quantities. The quantities can be organized in a ratio table. The columns are filled with pairs of numbers that have the same ratio. This is almost exactly like a fraction equivalency Table.
Mini-Lesson Tool: Ratio Tables What quantities come next in this ratio table?
Practice: Work with your partner to complete this table. Mario can ride his bike 40 miles in 2 hours. How many miles can he ride in 7 hours? Answer: 140 miles
You try it: Work with a partner to complete this table on your practice sheet. How How many steps does the son take when the father takes 15 steps?
2 Minute Talk Partner 1: Tell your partner what you recall about graphing on the coordinate plane. Partner 2: Tell your partner what you recall about graphing on the coordinate Plane. Share:
Ratio Tables Complete the table using repeated addition (multiplication).
New Concept: Ratio Tables and the Coordinate Plane. • A ratio table can be used to create ordered pairs. • The ordered pairs can then be graphed on the coordinate plane. • Equivalent ratios always create a straight line on the graph.
Minilesson: Learnzillion https://learnzillion.com/lesson_plans/8784-solve-ratio-problems-by-graphing-on-a-coordinate-plane
Why do we graph ratios on the coordinate plane? We can use the table to complete the graph. We can also use the GRAPH to complete the Table.
Why do we graph ratios on the Coordinate Plane? Lines on the coordinate plane tell a story. First, they help us to visualize the data. They also let us compare data. The steeper the line, the greater the ratio. The blue line has a ratio of 1:2. The red line has a greater ratio of 1:4. So the red line is steeper. (More vertical.)
Guided Practice: Ratio Tables and the Coordinate Plane. • Complete the ratio table at the top of your page. • First create the ordered pairs from the x and y values on your table. • Then plot the ordered pairs on the coordinate plane.
You try it: Work with your partner to complete The remaining tables in your practice sheet.
Solution: Did yours look like this? If it did, complete the next table and graph.
Solution: Did yours look like this? If it did, you are ready for Independent Practice. If not, please raise your hand so I can help you.
Independent Practice • Think/Pair/Share Activity: With your partner, complete the problems on page 218 and 219. • Remember: Do not move on to the next problem until both you and your partner agree on the answer! • If you finish before the bell, do the HOT problems on page 220. • If you DO NOT finish, you have to finish for HW.
Summary – Let’s Talk About It Why would you choose to use a graph to represent a ratio? What do you think would happen to the line on your graph if the ratios were not equivalent? What is one question you still have about graphing with ratio tables?