Download
1 / 8
80 likes | 160 Views
Composition of graphs. Composing graphs. Composition is substitution of values into other functions. This can be done with graphs and tables. Let’s see it in action. For the following graph complete the table of f(x). Then complete the table of g(x). Completion of tables.

E N D
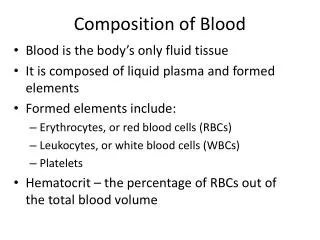
Composing graphs • Composition is substitution of values into other functions. • This can be done with graphs and tables.
Let’s see it in action • For the following graph complete the table of f(x). Then complete the table of g(x).
Completion of tables • Use graph to fill in points from it for f(x). Use function to fill in points for g(x).
Finding g(f(x)) • Complete the table and graph for g(f(x)). Notice in the table the x’s are from f(x). Take the corresponding y and look it up as an x in g(x).
Answer • Fill in table then graph. • G(f(x)):
Finding f(g(x)) • Complete the table and graph for f(g(x)). Notice in the table the x’s are from g(x). Take the corresponding y and look it up as an x in f(x).
Answer • Fill in table then graph. • f(g(x)):