Download
1 / 18
200 likes | 535 Views
Exponential Decay Functions. AII, 12.0: Students know the laws of fractional exponents, understand exponential functions, and use these functions in problems involving exponential growth and decay. . Objectives. Graph exponential decay functions. Recall: Translations of Exponential Functions.

E N D
Exponential Decay Functions AII, 12.0: Students know the laws of fractional exponents, understand exponential functions, and use these functions in problems involving exponential growth and decay.
Objectives • Graph exponential decay functions
Recall: Translations of Exponential Functions • Translating Exponential Functions • If |a|>1, the graph is vertically expanded • If |a|<1, the graph is vertically compress • If a is negative, the graph is reflected about the x-axis • h represents an horizontal shift on the graph • k represents a vertical shift on the graph
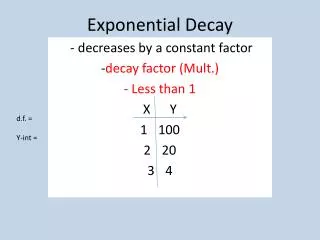
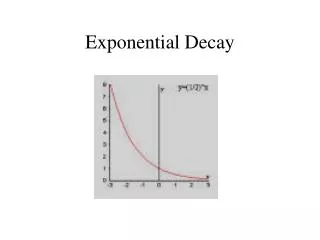
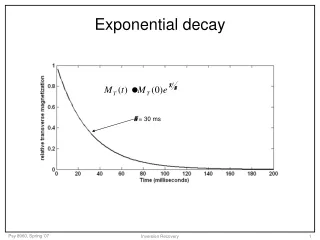
Objective 1: Exponential Decay Function Exponential Decay Graphs when a>0 and 0<b<1 • The graph falls from left to right • The graph passes through (0,a) and (1,ab) • The domain is all real numbers • The range is y>0
Properties of Exponential Functions State the Domain and Range Horizontal Asymptote • The Domain • Domain = All real numbers • The range • Above the horizontal asymptote y=k • Range = y>k • The horizontal asymptote is the minimum y-value. • y=k is the minimum value from the general form:
Recall:The Steps to Graphing • Make a table of values for the function. • We only require to plot points for x=0 and x=1 • Plot the points from the table. • Graph the asymptote y=k • Draw a curve that passes through the plotted points. • The graph shall remain above the asymptote y=k
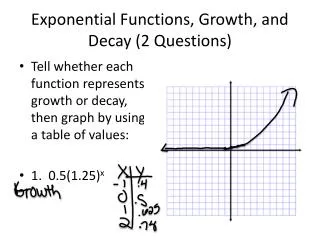
Example 1 1 1 1 4 2 2 SOLUTION Make a table of values for the function. y b x = < < 0 b 1 x 0 1 2 1 3 2 – – – y 8 4 2 1 Graph when x Graph the function y =
Example 1 y b x = < < 0 b 1 Graph when Plot the points from the table. Draw a curve that passes through the plotted points, as shown.
Example 2 3 3 3 1 8 2 4 2 SOLUTION < < 0 b 1 a. Make a table of values. 1 – x 0 1 2 3 y 6 3 Graph when y ab x = Graph the function. x x 1 2 a. b. y y 3 = = 4 3
Example 2 < < 0 b 1 b. Make a table of values. x 2 1 0 1 2 – – 9 3 1 1 1 y 8 4 6 9 16 Graph when y ab x = Plot the points. Draw a curve that passes through the plotted points, as shown at the right.
Example 2 < < 0 b 1 Graph when y ab x = Plot the points. Draw a curve that passes through the plotted points, as shown at the right.
SOLUTION > y 0. x 1 Sketch the graph of the function . It passes through and y = 2 ( ). ( ) – 2, 4 0, 1 Example 3 Graph an Exponential Function 1 x 2 Graph . Describe the horizontal asymptote. State the domain and range. – y = 2 Translate the graph 2 units to the right. The graph’s asymptote is the x-axis. The domain is all real numbers, and the range is
Example 4 x The graph’s asymptote is the line Graph Describe the horizontal asymptote. State the domain and range. y 3. = . y 3 = + 2 2 3 3 SOLUTION > y 3. Sketch the graph of the function . The domain is all real numbers, and the range is x y = It passes through and . 1 1 – – 2, 5 2, 2 4 4 ( ( ) ) 0, 1 0, 4 It passes through and . Graph an Exponential Function Translate the graph 3 units up.
Checkpoint 1 x 3 2 y 0; = > y 0 ANSWER domain: all real numbers, range: Graph an Exponential Function Graph the function. Describe the horizontal asymptote. State the domain and range. + 7. y =
Checkpoint 3 x5 4 y 0; = > y 0 ANSWER domain: all real numbers, range: Graph an Exponential Function Graph the function. Describe the horizontal asymptote. State the domain and range. – 8. y =
Checkpoint ANSWER > y domain: all real numbers, range: – y 2; = – 2 Graph an Exponential Function Graph the function. Describe the horizontal asymptote. State the domain and range. x 1 9. y – 2 = 4
Checkpoint x y 3 = + 1 3 y 3; = > y 3 ANSWER domain: all real numbers, range: Graph an Exponential Function Graph the function. Describe the horizontal asymptote. State the domain and range. 10.
Conclusion Summary Assignment • What does the graph of an exponential decay function look like? • The graph of an exponential growth function of the form • Exponential Decay • Pg422 #(11-38 ODD, 49,50 EC) • Problems not finished will be left as homework.