Download
1 / 14
140 likes | 314 Views
7.2 Exponential Decay. P. 486. Exponential Decay. Has the same form as growth functions f(x) = ab x Where a > 0 BUT: 0 < b < 1 (a fraction between 0 & 1). Recognizing growth and decay functions. State whether f(x) is an exponential growth or decay function f(x) = 5(2/3) x

E N D
7.2 Exponential Decay P. 486
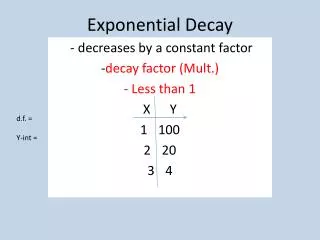
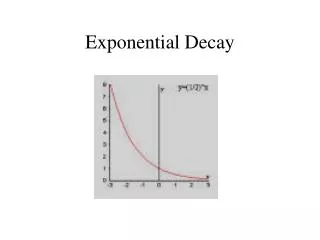
Exponential Decay • Has the same form as growth functions f(x) = abx • Where a > 0 • BUT: • 0 < b < 1 (a fraction between 0 & 1)
Recognizing growth and decay functions • State whether f(x) is an exponential growth or decay function • f(x) = 5(2/3)x • b=2/3, 0<b<1 it is a decay function. • f(x) = 8(3/2)x • b= 3/2, b>1 it is a growth function. • f(x) = 10(3)-x • rewrite as f(x)=10(1/3)x so it is decay
Recall from 7.1: • The graph of y= abx • Passes thru the point (0,a) (the y intercept is a) • The x-axis is the asymptote of the graph • a tells you up or down • D is all reals (the Domain) • R is y>0 if a>0 and y<0 if a<0 • (the Range)
Graph: • y = 3(1/4)x • Plot (0,3) and (1,3/4) • Draw & label asymptote • Connect the dots using the asymptote y=0 Domain = all reals Range = reals>0
Graph • y = -5(2/3)x • Plot (0,-5) and (1,-10/3) • Draw & label asymptote • Connect the dots using the asymptote y=0 Domain : all reals Range : y < 0
Now remember: To graph a general Exponential Function: • y = a bx-h + k • Sketch y = a bx • h= ??? k= ??? • Move your 2 points h units left or right …and k units up or down • Then sketch the graph with the 2 new points.
Example graph y=-3(1/2)x+2+1 • Lightly sketch y=-3·(1/2)x • Passes thru (0,-3) & (1,-3/2) • h=-2, k=1 • Move your 2 points to the left 2 and up 1 • AND your asymptote k units (1 unit up in this case)
y=1 Domain : all reals Range : y<1
Using Exponential Decay Models • When a real life quantity decreases by fixed percent each year (or other time period), the amount y of the quantity after t years can be modeled by: • y = a(1-r)t • Where a is the initial amount and r is the percent decrease expressed as a decimal. • The quantity 1-r is called the decay factor
Ex: Buying a car! • You buy a new car for $24,000. • The value y of this car decreases by 16% each year. • Write an exponential decay model for the value of the car. • Use the model to estimate the value after 2 years. • Graph the model. • Use the graph to estimate when the car will have a value of $12,000.
Let t be the number of years since you bought the car. • The model is: y = a(1-r)t • = 24,000(1-.16)t • = 24,000(.84)t • Note: .84 is the decay factor • When t = 2 the value is y=24,000(.84)2 ≈ $16,934
Now Graph The car will have a value of $12,000 in 4 years!!!