Download
1 / 13
130 likes | 530 Views
7.1 Exponential Functions, Growth, and Decay. Exponential Functions. An exponential function is a function of the form :. Graphs . What is the difference between the following functions? f(x) = 2 x f(x) = (1/2) x

E N D
Exponential Functions • An exponential function is a function of the form :
Graphs • What is the difference between the following functions? • f(x) = 2x f(x) = (1/2)x • Now graph them without using the graph function on the calculator (i.e., use a table) • What do you notice?
Asymptotes • Both of these graphs have asymptotes. Where? • These graphs both approach 0, but will never reach 0. Why? • So, what would the domain and range be for these functions?
Growth and Decay • A function of the form f(x) = abx models either exponential growth or decay. • In either case, a > 0 • What conditions would make it a growth equation? • What conditions would make it a decay equation?
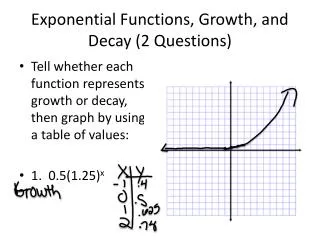
Tell whether the following functions are exponential growth or decay • f(x) = 5(1/3)x • f(x) = 3(1.2)x
Modeling growth or decay • You can model growth or decay by a constant percent increase or decrease by the following formula:
Clara invests $5000 in an account that pays 6.2% interest per year. After how many years will her investment be worth $10,000? Is this a growth or decay problem? What is the equation? What is A(t)? What is a? What is r? What is t? Write the equation with those values and graph to find the answer.
On your own • A city population, which was initially 15,500, has been dropping by 3% a year. Write an exponential function and graph the functions. Use the graph to predict when the population will drop below 8000.
Whiteboards • Tell whether the function shows growth or decay. • f(x) = 32(0.5)x • f(x) = 0.5(1.2)x • f(x) = 0.4(3/4)x
An acidophilus culture containing 150 bacteria doubles in population every hour. Predict the number of bacteria after 12 hrs. • Write a function representing the bacteria population for every hour that passes. • Graph the function • Use the graph to predict the number of bacteria after 12 hours.
A new softball dropped onto a hard surface from a height of 25 in. rebounds to about 2/5 the height on each successive bounce. • Write a function representing the rebound height for each bounce. • Graph the function. • After how many bounces would a new softball rebound less than one inch?
THE VALUE OF A TRUCK BOUGHT NEW FOR $28,000 DECREASES 0.5% EACH YEAR. WRITE AN EXPONENTIAL FUNCTION, AND GRAPH THE FUNCTION. USE THE GRAPH TO PREDICT WHEN THE VALUE WILL FALL TO $5000.