Download
1 / 18
180 likes | 318 Views
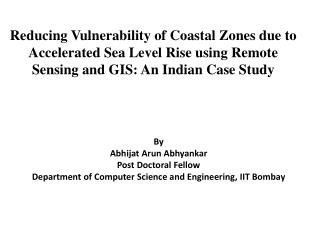
Paddy Damage Assessment due to Cyclonic Storm using Remotely Sensed Data By ABHIJAT ARUN ABHYANKAR October 4, 2010. Scheme of Presentation. Overview of the problem Literature review Case study: Orissa Super cyclone Approaches for Damage assessment using R. S. Data

E N D
Paddy Damage Assessment due to Cyclonic Storm using Remotely Sensed Data ByABHIJAT ARUN ABHYANKAR October 4, 2010
Scheme of Presentation Overview of the problem Literature review Case study: Orissa Super cyclone Approaches for Damage assessment using R. S. Data Results and discussion Concluding remarks
Overview of the Problem Indian Coastline (around 7500 kms) No. of Cyclones crossing Indian Coastline per year-8 to 9 (Abhyankar et al., 2004) State with maximum no. of Cyclone crossing-Orissa state (Abhyankar et al., 2004) Severe cyclonic event leads to loss of human life and property, Inundation of low areas, health issues, crop damage and loss of fertility, drinking water pollution, beach erosion No standard tool available to assess damage to paddy or crops Problem statement/objective Rapidly and quantitatively identify affected areas due to cyclone using remotely sensed data Usefulness of the present study Improve damage assessment, expediting the relief funds
Determining water threshold in pre event SAR using Pre event IRS and Pre event Radar Assessing changes in backscattering values of Landcover of Interest Utilizing Pre event SAR and Field data as baseline information Threshold Non Threshold Qualitative Quantitative Approaches • Deterministic 1. Change in dB 1. Histogram approach 1. Deterministic1. Supervised classification2. Probabilistic a) IRS as a base with SGT 2. Probabilistic with Max. likelihood • Minimum b) Field data 2. Tool for complete/ 3. Discriminant Classifier • Difference and SAR partial/non 2. ANN • in Area imagery submerged rice • Spatial 2. Histogram • Correlation approach Coefficient a) IRS as a base b) field data • and SAR imagery • (A) (B) (C)
Landover map of Kendrapara district using IRS 1D LISS III image of October 11, 1999 Standard FCC of IRS 1D LISS III for October 11, 1999
Damage Monitoring Tool Procurement of cloud free IRS 1D LISS III Image Procure pre and post event Radarsat images Pre processing (speckle noise removal and Incidence angle correction) Landcover classification Base map (masking of all landcovers other than landcover of interest) Delineation of submerged areas by setting threshold to classify water/non-water in SAR Overlay Completely submerged landcover of interest i.e. paddy Framework for Identification of completely submerged Landcovers from Cyclone Disasters using Remotely sensed Data
Case Study-Orissa Super cyclone Pre event : IRS 1D LISS III image of October 11, 1999 Radarsat-1 SAR images of October 11, 1999 Post event : Radarsat-1 SAR images of November 2, 1999 and November 4, 1999
October 11, 1999 November 2, 1999 November 4, 1999
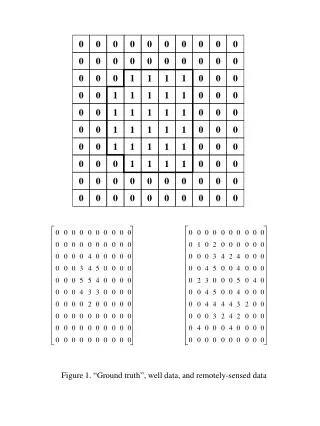
Total 666 pixels 486 pixels for estimation 120 pixels-known water and 366 pixels are of known non water pixels Remaining 180 pixels for validation,. Water 45 pixels and Non water 135
Water in Radarsat-1 SAR image of October 11, 1999 Completely submerged areas under water on November 2, 1999 Completely submerged areas under water on November 4, 1999
Known Classified Water Non water Water 118 2 Non water 10 356 Known Classified Water Non water Water 35 10 Non water 0 135 Confusion matrix for estimation set of October 11, 1999 Overall accuracy=474/486=97.5% Confusion matrix for validation set of October 11, 1999 Overall accuracy=170/180=94.4%
ResultPaddy completely submerged on November 4, 1999 due to Orissa super cyclone Method Threshold for Water Paddy crop completely submerged (in thousand hectares) Approach A Deterministic -14.0 dB 16.2188 Probabilistic -15.0 dB 14.5496 Minimum Difference in Area -14.5 dB 15.33 Spatial Correlation Coefficient -16.4 dB 12.5806 Approach C Deterministic -12.0 20.5435 Probabilistic -19.5 8.316 Discriminant -14.8 14.876 Supervised Classification with Maximum Likelihood - 14.684 ANN - 14.731
Concluding Remarks • The remote sensing as a tool can play an important role in damage assessment and relief/enumeration operations • Microwave data of Radarsat-1 SAR HH polarized data and Envisat ASAR VV polarized data find application in the submergence analysis • The Remote sensing data results obtained are quantitative in nature • Water subclasses namely, sea, pond and river have significantly different backscattering responses in SAR. • Methods developed in the present study using Remote sensing data would find application in disaster monitoring and management • The developed methods using Remote Sensing data can be used at different management levels for decision making • The developed methods could be applicable to other similar kind of disaster namely floods, heavy rainfall, tsunami etc. • The developed methods can play a key role in decision making of national policy on disaster management.
Level of Management Methods recommended Output Accuracy Strategic Management (policy level) i.e. Central Deterministic Affected States Low Tactical Management (planning level) i.e. State Probabilistic Affected District Medium Operational Management level i.e. District/sub district Maximum Likelihood, ANN, Discriminant Affected Land Parcels High Decision making tool for various management strategy with recommended models