Download
1 / 28
280 likes | 417 Views
Predictive Modeling of West Nile Virus Outbreaks Using Remotely-Sensed Data. Dr. Michael Ward Professor of Epidemiology College of Veterinary Medicine Texas A&M University. James Steele Conference on Diseases in Nature Transmissible to Man, Austin, 11 June 2007. James Schuermann

E N D
Predictive Modeling of West Nile Virus Outbreaks Using Remotely-Sensed Data Dr. Michael Ward Professor of Epidemiology College of Veterinary Medicine Texas A&M University James Steele Conference on Diseases in Nature Transmissible to Man, Austin, 11 June 2007
James Schuermann Zoonosis Control Group Texas Department of State Health Services, Austin TX Linda Highfield Department of Veterinary Integrative Biosciences Texas A&M University, College Station TX partial funding provided by the Texas Equine Research Advisory Committee
Outline • Background • Methods • Results • Discussion • Conclusions
West Nile Virus • family Flaviviridae genus Flavivirus • Japanese Encephalitis serocomplex, includes: • Japanese encephalitis • Murray Valley encephalitis • St. Louis encephalitis • Kunjin • antigenically, all closely related
WNV History • first occurrence in U.S.: 1999 ( Bronx Zoo, New York ) • by 2001: extension of range to include Florida • 2002: large equine epidemic • by 2003: 46 states, 7 Canadian provinces, 5 Mexican states • only states WNV not detected: Alaska, Hawaii
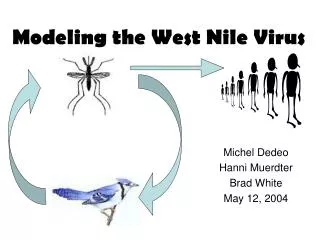
WNV Life Cycle • Vector • Mosquito • Reservoir • Wild birds • Dead end host • Horses and humans
WNV Mosquito Vectors • biological and mechanical vectors • 14 species identified • Culex spp. most likely in the U.S. • breed in standing water • Cx. pipiens, quiquefasciatus, tarsalis • Aedes spp. may spread disease to horses • breed in locations where water will be present
WNV Avian Reservoirs • responsible for distribution • >110 species of birds • most susceptible species include American crows, fish jays, blue jays • game species (wild ducks, geese, pheasants, turkeys, pigeons, doves) • raptors (owls, hawks, eagles)
WNV Surveillance Programs • avian mortality surveillance tracking system • mosquito trapping and testing • testing wild birds, sentinel chickens, horses and humans with neurologic disease • forecasting systems: environmental variables • temperature • precipitation • remotely-sensed data
reported cases of equine WNV encephalomyelitis: 2002, 2003 and 2004 • time series of case reports, 2-week window • image data: 2-week 1km2 resolution rasters of the Normalized Difference Vegetation Index (NDVI) • mean NDVI for each 2-week period • periods with versus without reported cases • autoregressive model: NDVI as a predictor of equine WNV cases (scaled, transform)
What is the NDVI? • Advanced Very High Resolution Radiometer (AVHRR) sensor, NOAA polar-orbiting satellite • Normalized Difference Vegetation Index: • visible and near-infrared data • daily observations biweekly 1km2 resolution raster based on daily maximum observed NDVI value • resulting 1x1 km pixel represents maximum scaled NDVI value during each 2 weeks of the study period
correlation, number of cases reported versus NDVI: 45% (P<0.001)
cases = – 0.9102 + 8.5762 (casesweeks 1–2) – 5.6137 (casesweeks 3–4) + 0.9262 (NDVIweeks 1–2) – 0.2661 (NDVIweeks 3–4) no. observed versus predicted cases highly correlated (rSP 83%, P<0.001)
Prevention and Control • reduce exposure • indoor housing, repellants? • mosquito control • larvicides, adulticides, environment • vaccination • killed or recombinant canarypox-vectored • 2 doses, 3-6 weeks apart; annual booster
Forecasting Systems • anticipate increases in risk • optimize control strategies • increased awareness • identify “hotspots” • sentinel warning for zoonotic disease
remotely-sensed data: • availability • low-cost • coverage • could be used to: • enhanced WNV surveillance • provide early warning of increased risk • identify hotspots • warn of potential zoonotic transmission of WNV