Download
1 / 15
150 likes | 293 Views
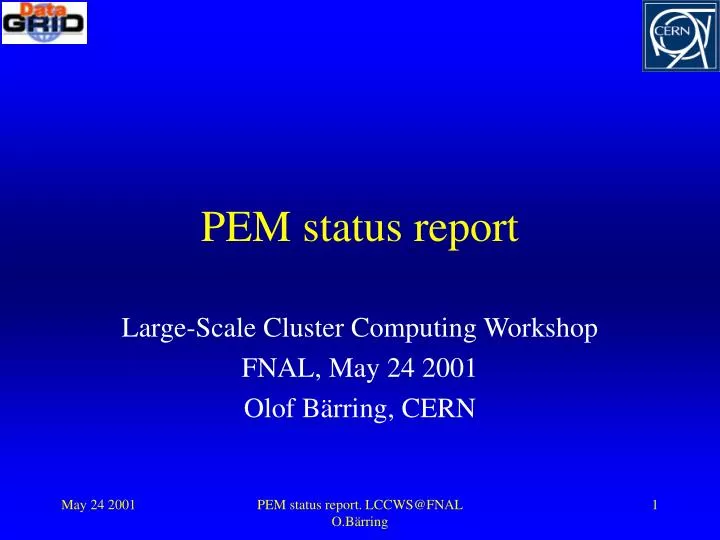
PEM status report. Large-Scale Cluster Computing Workshop FNAL, May 24 2001 Olof B ä rring, CERN. Outline. History Design First prototype DataGrid fabric mgmt monitoring task Conclusions. History. The Performance and Exception Monitoring (PEM) project is a CERN IT project since 1999

E N D
PEM status report Large-Scale Cluster Computing Workshop FNAL, May 24 2001 Olof Bärring, CERN PEM status report. LCCWS@FNAL O.Bärring
Outline • History • Design • First prototype • DataGrid fabric mgmt monitoring task • Conclusions PEM status report. LCCWS@FNAL O.Bärring
History • The Performance and Exception Monitoring (PEM) project is a CERN IT project since 1999 • Leader: Tim Smith, Bernd Panzer-Steindel from 2001 • Goal (and innovation): Monitor and alarm on service rather than server • Long requirement phase with input from many IT groups • Design settled in mid-2000 PEM status report. LCCWS@FNAL O.Bärring
Design 1..n 1 1..n 1 Measurement repository (MR) 1 Agent Broker 1..n 1 sensors actuators 1 1 1..n Configuration Repository (CR) Correlation Engine (CE) 1 1..n 1 1..n User Interface Access control Data Control PEM status report. LCCWS@FNAL O.Bärring
Design: agent • The agent forwards data from monitoring sensors to the broker • Buffering of data for transfer efficiency and fault tolerance • The configuration of local sensors and actuators is received via the broker • Firing of actuators is triggered by MR (or CE) via broker to the agent PEM status report. LCCWS@FNAL O.Bärring
Design: broker • The broker was introduced for scalability • Transmitter of configuration information to • Agents • Measurement repository • Transmitter of measurement data from agent to measurement repository • Transmitter of requests for firing actuators from MR to the agents PEM status report. LCCWS@FNAL O.Bärring
Design: measurement repository • The MR is the central archive of all monitoring measurements • Data compression (e.g. averaging old data) • Not just a passive database: active notification of subscribed event listeners if a measurement is outside its configured limits; triggering recovery actions PEM status report. LCCWS@FNAL O.Bärring
Design: configuration repository • The configuration repository contains the configuration for all other components and their relationships, e.g. • Agent: • Metrics and measurement frequency • Actuators • Broker: • What agents to control • Measurement repository • Metric limits • Subscribed event listeners PEM status report. LCCWS@FNAL O.Bärring
First prototype • The first PEM prototype was ready for deployment early 2001 • Agent status: • Each agent measures 30 parameters (from system CPU to running daemons) • Frequency: measure every 30 seconds • Deployed on 400 nodes since ~7 weeks. Soon go to about 1000 nodes. PEM status report. LCCWS@FNAL O.Bärring
First prototype • Broker status: • The multithreaded broker contacts its assigned agents once per minute and retrieves: • Configuration: which metrics have been monitored • The measurements since last request • The broker uses JDBC to write the measurements into an ORACLE database • Each measurement value and its timestamp • Current configuration ~50 agents per broker • Data rate ~1GB/day PEM status report. LCCWS@FNAL O.Bärring
First prototype • Measurement repository status: • Some scalability problems in the beginning. Related with threading in JDBC • The ORACLE installation is currently upgraded to cope with increasing load (concurrent read and write): • Dual CPU PIII 800MHz • 512MB memory • Gigabit ethernet • 750GB mirrored EIDE disk server • Plan to have a cluster of database nodes to cope with anticipated load in the future PEM status report. LCCWS@FNAL O.Bärring
DataGrid fabric mgmt (WP4) • PEM prototype will most likely be adopted • WP4 promotes: • High node autonomy. Monitoring hierarchies where lowest level can be entirely confined to a node (tight sensor-actuator loops) • PEM configuration repository will be replaced by WP4 configuration management system • Possibly use the transport layer from WP3 framework based on the GMA (Grid Monitoring Architecture) producer-consumer model PEM status report. LCCWS@FNAL O.Bärring
Monitoring hierarchy GRID Fabric view GUI MR Correlation Engine (CE) Cluster view Configuration Management system Node view Node Config cache sensor CE Agent Actuator sensor sensor MR cache PEM status report. LCCWS@FNAL O.Bärring
Service view • How to translate measured simple metrics into a service view? • Some preliminary plans in WP4: • Create probes that act as user programs (configurable for different CPU, memory, I/O, … characteristics) • Run probes on idle systems -> benchmarking • Run probes under different load conditions and measure concurrently a set of simple metrics (e.g. CPU load, memory usage, I/O rates, bandwidth to homedirectory, …) -> matrix for mapping of expected performance PEM status report. LCCWS@FNAL O.Bärring
Conclusions • After a long requirements and design phase, PEM has now reached a working prototype • PEM will be adopted by WP4 with slight modifications • Node autonomy, monitoring hierarchy • Use central fabric configuration mgmt • May implement GMA interfaces provided by WP3 for monitoring transport and publication mechanisms PEM status report. LCCWS@FNAL O.Bärring