Download
1 / 7
70 likes | 244 Views
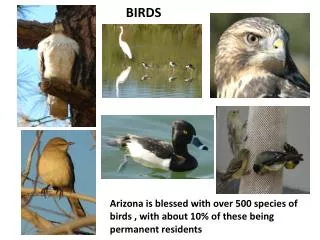
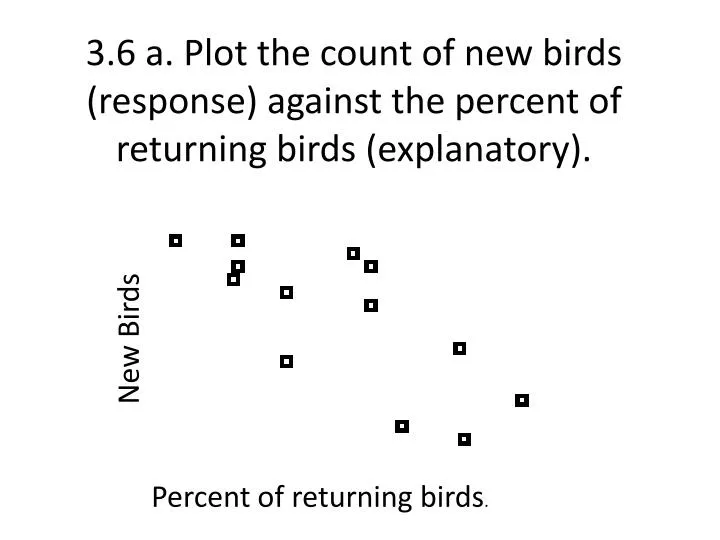
3.6 a. Plot the count of new birds (response) against the percent of returning birds (explanatory). New Birds. Percent of returning birds.

E N D
3.6 a. Plot the count of new birds (response) against the percent of returning birds (explanatory). New Birds Percent of returning birds.
b. Describe the direction( - ), form (linear) , and strength (strong relationship) of the relationship between number of new (CHICKEN)hawks in a colony and percentage of returning adults.
c. The (MOUSE)hawk is a longlived territorial species. (the association is negative)
3.34 a. Use your calculator’s regression function to find the equation of the least-squares regression line.New Adults = 31.934 – 0.304 (Percent returning )
b. Use your calculator to find the mean and standard deviation of both x and y and their correlation.c. Calculate the slope and y-intercept.
d. The slope: as the percent of returning birds increases by one, the number of new birds decreases by 0.304 on average.Y-intercept: We should see 31.9 (32) new adult birds in a colony if the returning percent of birds is zero.
e. 31.9 – 0.304 (60) = 13.69 of about 14 new adult birds will join another colony.