Download
1 / 9
90 likes | 181 Views
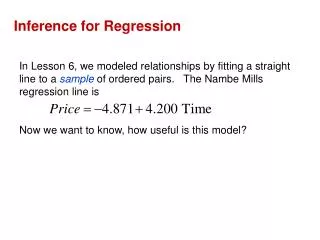
Inference About Prediction and Checking the Regression Assumptions. Sections 14.2 and 14.3. LSRL. We use the LSRL to predict a response to a specific value of x by substituting. We can give a confidence interval to describe how accurate a prediction is. Depends on whether:

E N D
Inference About Prediction and Checking the Regression Assumptions Sections 14.2 and 14.3
LSRL • We use the LSRL to predict a response to a specific value of x by substituting. • We can give a confidence interval to describe how accurate a prediction is. • Depends on whether: • You want to predict the mean y for all the times that x is a certain value. • You want to predict the value of y for one specific time that x is a certain value.
To Estimate Mean Response: • µy = α + βx* (x* is specific value of x) • Use a confidence interval. • y-hat ± t* SEµ-hat To Estimate Individual Response: • µy = α + βx* (x* is specific value of x) • Use a prediction interval. • y-hat ± t* SEy-hat
Use Software Printouts Example: Predict what the average gas consumption would be for any month with an average of 20 degree-day days. Predict for the individual month of March of this year. Remember LSRL: Y-hat = 1.0892 + .1890x Fit Stdev.Fit 95% C.I. 95% P.I. 4.8692 .0855 (4.6858, 5.0526) (4.1193, 5.6191) SEµ-hat
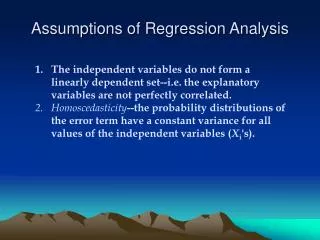
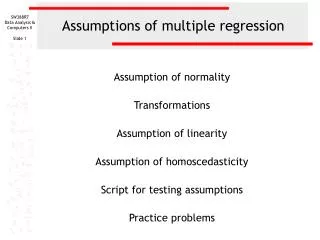
Checking Regression Assumptions: • The true relationship is linear • The standard deviation of the response about the true line is the same everywhere. • The response varies normally about the true regression line.
True Relationship is Linear: • Look at scatterplot: linear? • Plot residuals: pattern?
Standard Deviation • The standard deviation of the response about the true line is the same everywhere. • Look at scatterplot. • Look at residuals plot: not safe if more, or less, scatter as x increases.
Response Varies Normally • Response varies normally about the true regression line. • Make a histogram or stemplot of residuals and check for normality. • Normal Probability Plot: linear? • Minor nonnormality is ok; influential observations can greatly affect results. • Prediction interval relies on normality, not just approximately normal, so our prediction intervals are rough approximations.