Download
1 / 20
200 likes | 484 Views
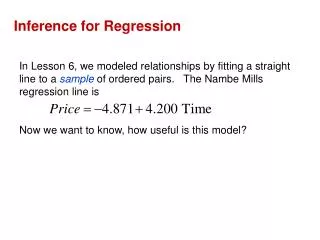
LSRL Regression Inference. LSRL Review. Good runners take more steps per second as they speed up. Here are the average number of steps per second for a group of top female runners at different speeds. What is the equation of the LSRL? What is the correlation coefficient and what does it mean?

E N D
LSRL Review • Good runners take more steps per second as they speed up. Here are the average number of steps per second for a group of top female runners at different speeds. What is the equation of the LSRL? What is the correlation coefficient and what does it mean? Fill in the residuals
Residuals • Residual = observed – predicted • Residual = • Easily done on calculator
Big Question Big Question: If we took another sample of 10 runners would we get the same LSRL?
LSRL is from a sample • Our LSRL is constructed from a single sample • Overall for the population there is a line of best fit: Remember we use sample statistics to estimate population parameters
Computer Print out Mr. Hopkins was interested in how the number of hours a student studied for the chapter 13 exam was related to the student’s score. Below is a printout of the regression run using mini-tab: S = 3.879 R-sq = 46.1% R-sq(adj) = 35.4% What is the equation of the LSRL? If we studied 3 hours and received a 68, what is the residual?
The true LSRL for the population For each specific x-value: We assume the distribution of y-values is normal The mean of the y-values is on the true LSRL Standard deviation of y-values about the line( ) is unknown.
Standard Deviation • Standard deviation: • Measure of how far points are from the true LSRL • Unknown (just like population standard deviation was unknown for most tests) We need to estimate the standard deviation. What did we do before when we used the t-test for standard deviation?
Standard Error • is an estimate of the true LSRL. • We estimate the standard deviation by using the residuals • Remember: residual is just the distance from the point to the line n = # of observations
Example • Running speed predicts foot speed • X(Explanatory) : running speed • Y(Response) : foot speed • Remember we got:
Calculating Standard Error • Use the lists!
Confidence Interval for the slope • True LSRL: • We don’t know the slope but we can construct a confidence interval for it using our sample! • Our sample gives us:
CI for slope in • Let’s construct a 95% CI for the slope of the true LSRL • We already found s = .0494 • To find we need
Interpreting this CI • This is a confidence interval for in • Remember x: running speed y: foot speed We are 95% confident, that foot speed increases between .0861 and .0941 steps/sec for each additional increase in running speed.
Print-out • Finding SEb is a pain. Trust me, that wasn’t much fun! • Usually you get a printout of a regression which makes finding SEb much easier
Example • We will predict BAC(blood alcohol content) using the number of beers an individual drinks. • We run a regression and get the following print out