Download
1 / 13
130 likes | 264 Views
NASA Earth Observatory. Modeling the Impact of Biomass Burning in Southeast Asia. Joshua S. Fu UT-ORNL Bredesen Center Energy Science and Engineering Department of Civil and Environmental Engineering. Computational Earth System Group Oak Ridge National Laboratory.

E N D
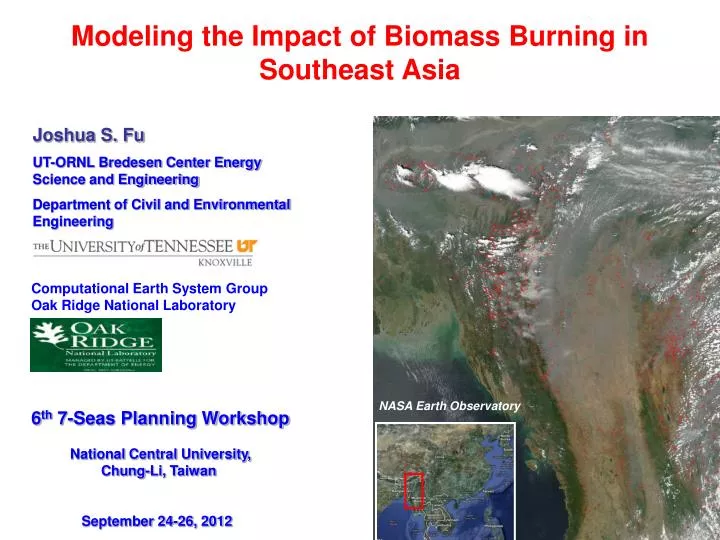
NASA Earth Observatory Modeling the Impact of Biomass Burning in Southeast Asia Joshua S. Fu UT-ORNL Bredesen Center Energy Science and Engineering Department of Civil and Environmental Engineering Computational Earth System Group Oak Ridge National Laboratory 6th 7-Seas Planning Workshop National Central University, Chung-Li, Taiwan September 24-26, 2012
Carbon Emission Comparison between FLAMBE and GFEDv2 Monthly carbon emission from FLAMBE and GFED Carbon emissions from FLAMBE is about 7-11 times higher than that from GFEDv2.1 in March and April, 2006. GFEDv3 is even lower.
Evaluation of FLAMBE and GFEDv2.1 in CMAQ Hengchun Phimai CO is chosen as a tracer for evaluating the model performance by using FLAMBE and GFED as emission input, respectively. Phimai (Obs. data source: NASA) Hengchun (Obs. data source: Taiwan EPA) The model has better capability to capture the intensive biomass burning episodes using FLAMBE than using GFED. Possible reasons: 1. Time resolution: FLAMBE is hourly while GFED is monthly or weekly. 2. Different treatment of the fuel type. GFED is lack of agriculture waste burning
Model Validation from Space-based Observation Relatively consistent spatial distribution as compared to the satellite observation Overestimation in Burma: possible overestimation of forest fires (activity data) Underestimation in the south: possible underestimation of agriculture burning
Regional Impact from Biomass Burning (Thailand) North Northeast Central South Month average Model biased high about 2-5 folds in northern Thailand Biomass burning contributed ~ 20 – 40% of total CO in the other regions of Thailand. Ground CO data: Thailand Pollution Control Department
Taiwan as a receptor under Influence of BB Data source: Taiwan EPA Supersites Southern Taiwan Northern Taiwan No correlation between CO and OC in northern Taiwan The influence of biomass burning ends here and resulted in distinct characteristics of aerosol chemistry in northern and southern Taiwan Strong correlation between CO and OC in southern Taiwan and decreasing trends of OC/EC ratios from March to May.
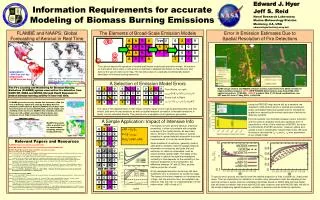
Monthly Surface Impact of Biomass Burning Emission Color contour: Base - Zero Out Case White Arrows: Horizontal Wind Red Contours(%): (Base - Zero Out Case)/Base In March, Southeast Asia biomass burning mainly affects southern part of East Asia, while in April, the impact could reach Yangtze River Delta region. Local impact of Southeast Asia biomass burning contributes about 30-60% to CO and PM2.5, and 10-20% to O3, while the transport impact could reach 20-40% to CO, 10-20% to O3 and 30-60% to PM2.5 in southern of East Asia.
Long-range Transport of Biomass Burning Aerosol AOD AAOD SSA Model generally captured the episodes of column aerosol optical depth at multi-AERONENT sites. Vietnam Thailand Thailand Hong Kong The transport pathway from SE Asia to downwind regions is both illustrated from model and observation Taiwan Red dot: AERONET observation, Blue lines: model results
Episodic Vertical Impact from Biomass Burning Comparison to MPL Lidar at Phimai Surface to 1km: Local impact dominates 1-5km: Transport could be very fast due to strong horizontal west wind; Pollutants start to downwash after long range transport, which is an important factor on surface impact. The long range transport could contribute 70% to CO and 80% to PM2.5. 5km-14km: Not much impact in both local and transport cases Deposition around the Taiwan Straits The discrepancy may come from the injection height method of distributing the emission
Conclusions • FLAMBE biomass emissions are about 7-11 times higher than GFEDv2.1 in March and April 2006, and through the comparison in Phimai and Hengchun, FLAMBE shows better consistence with observational data. • Overall, GEOS-Chem/CMAQ predicts similar spatial distributions as compared to various satellite sensors; model comparison to various ground measurements suggested underestimation, which was attributed to the underestimated emission (local and/or biomass burning). The long-range transport pattern from the source region to downwind areas was well illustrated. • Monthly average impacts from biomass burning in Southeast Asia on East Asia could reach 4-6 ppbv for O3, 40-120 ppbv for CO, and 10-80 ug/m3 for PM2.5. Local impact of SA BB contributes about 30-60% to CO and PM2.5, and 10-20% to O3, while the transport impact could reach 20-40% to CO, 10-20% to O3 and 30-60% to PM2.5 in southern of East Asia. • Gases and aerosol had a strong upward transport from surface to high altitudes. The eastward transport becomes strong from 2 to 8 km in the free troposphere. The subsidence process during the long-range transport contributed 60 to 70%, 20 to 50%, and 80% on CO, O3 and PM2.5,respectively.
Suggestions and Future Works • Local emission data in Southeast Asia should be improved as this area is fast developing. Local emission factors (EFs) for different types of biofuel (e.g. agriculture, savanna, forest) are needed for more accurate estimation of the biomass burning emission. • Ground monitoring site is suggested to be set up in areas that more close to the source of intense biomass burning. • How will the atmospheric composition evolve from biomass burning source region to downwind regions via the long-range transport? How does local emission mix with biomass burning? And what’s the quantitative contribution from local emission and biomass burning at various areas? • Vertical profile measurement (e.g. flight or sounding) of gases and aerosol will be essentially for evaluating the convection process and quantifying the outflow/inflow fluxes in the model. Some unique tracers (e.g. HCN, levoglucosan) from biomass burning will be helpful. • Radiative forcing changes on the UTLS (Upper Troposphere – Lower Stratosphere) due to injection of large biomass burning emission is necessary to be discussed. Vertical profile of temperature, water vapor and cloud properties should be influenced, and hence feedback to regional climate change.
Acknowledgement We thank NASA GSFC on funding support (grant no.: NNX09AG75G). Data products from SMART-COMMIT and Deep Blue groups of NASA GSFC are funded by the NASA Radiation Sciences Program, managed by Dr. Hal Maring. We thank Dr. Edward J. Hyer for providing FLAMBE biomass burning emission data. We thank Thailand PCD, EANET, Taiwan EPA, Hong Kong EPD and AERONET for proving the measurement data. We would also like to thank Dr. Can Li from NASA for providing satellite products and observational data in Phimai, Dr. Carlo Wang for providing Lulin Mountain data and Dr. Hsin-Chih Lai for providing monitoring data in Taiwan. More info
Thanks for your attention! Questions ?