Download
1 / 1

E N D
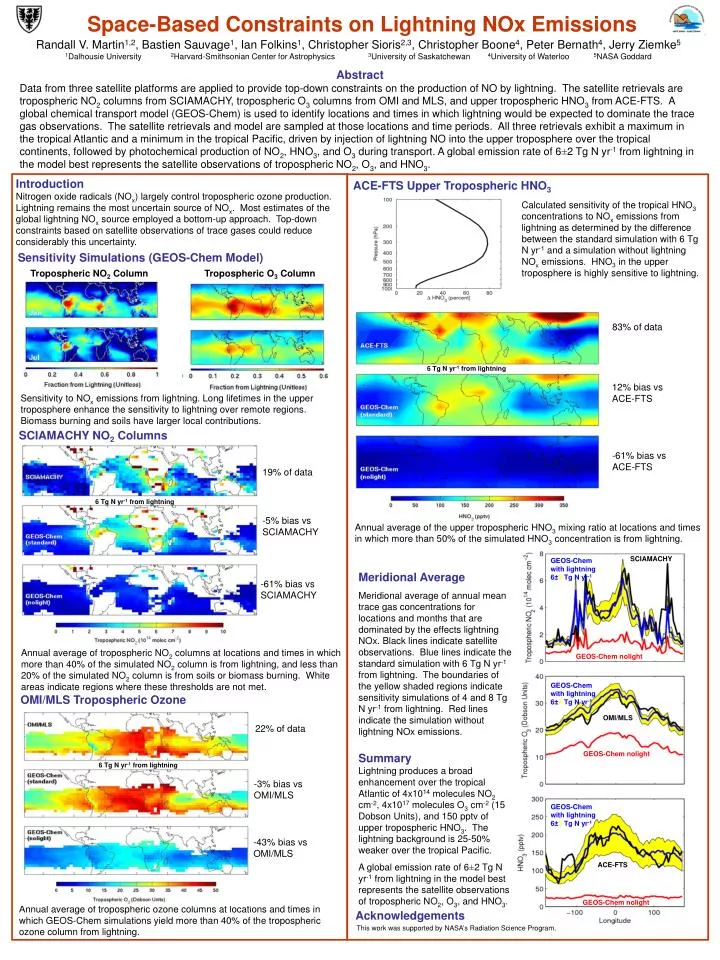
Randall V. Martin1,2, Bastien Sauvage1, Ian Folkins1, Christopher Sioris2,3, Christopher Boone4, Peter Bernath4, Jerry Ziemke51Dalhousie University 2Harvard-Smithsonian Center for Astrophysics 3University of Saskatchewan 4University of Waterloo 5NASA Goddard Abstract Data from three satellite platforms are applied to provide top-down constraints on the production of NO by lightning. The satellite retrievals are tropospheric NO2 columns from SCIAMACHY, tropospheric O3 columns from OMI and MLS, and upper tropospheric HNO3 from ACE-FTS. A global chemical transport model (GEOS-Chem) is used to identify locations and times in which lightning would be expected to dominate the trace gas observations. The satellite retrievals and model are sampled at those locations and time periods. All three retrievals exhibit a maximum in the tropical Atlantic and a minimum in the tropical Pacific, driven by injection of lightning NO into the upper troposphere over the tropical continents, followed by photochemical production of NO2, HNO3, and O3 during transport. A global emission rate of 6±2 Tg N yr-1 from lightning in the model best represents the satellite observations of tropospheric NO2, O3, and HNO3. Space-Based Constraints on Lightning NOx Emissions Introduction Nitrogen oxide radicals (NOx) largely control tropospheric ozone production. Lightning remains the most uncertain source of NOx. Most estimates of the global lightning NOx source employed a bottom-up approach. Top-down constraints based on satellite observations of trace gases could reduce considerably this uncertainty. ACE-FTS Upper Tropospheric HNO3 Calculated sensitivity of the tropical HNO3 concentrations to NOx emissions from lightning as determined by the difference between the standard simulation with 6 Tg N yr-1 and a simulation without lightning NOx emissions. HNO3 in the upper troposphere is highly sensitive to lightning. Sensitivity Simulations (GEOS-Chem Model) Tropospheric NO2 Column Tropospheric O3 Column 83% of data 6 Tg N yr-1 from lightning 12% bias vs ACE-FTS Sensitivity to NOx emissions from lightning. Long lifetimes in the upper troposphere enhance the sensitivity to lightning over remote regions. Biomass burning and soils have larger local contributions. SCIAMACHY NO2 Columns -61% bias vs ACE-FTS 19% of data 6 Tg N yr-1 from lightning -5% bias vs SCIAMACHY Annual average of the upper tropospheric HNO3 mixing ratio at locations and times in which more than 50% of the simulated HNO3 concentration is from lightning. SCIAMACHY GEOS-Chem with lightning 6±2 Tg N yr-1 Meridional Average Meridional average of annual mean trace gas concentrations for locations and months that are dominated by the effects lightning NOx. Black lines indicate satellite observations. Blue lines indicate the standard simulation with 6 Tg N yr-1 from lightning. The boundaries of the yellow shaded regions indicate sensitivity simulations of 4 and 8 Tg N yr-1 from lightning. Red lines indicate the simulation without lightning NOx emissions. Summary Lightning produces a broad enhancement over the tropical Atlantic of 4x10¹⁴ molecules NO2 cm‑2, 4x10¹⁷ molecules O3 cm-2 (15 Dobson Units), and 150 pptv of upper tropospheric HNO3. The lightning background is 25-50% weaker over the tropical Pacific. A global emission rate of 6±2 Tg N yr-1 from lightning in the model best represents the satellite observations of tropospheric NO2, O3, and HNO3. -61% bias vs SCIAMACHY Annual average of tropospheric NO2 columns at locations and times in which more than 40% of the simulated NO2 column is from lightning, and less than 20% of the simulated NO2 column is from soils or biomass burning. White areas indicate regions where these thresholds are not met. GEOS-Chem nolight GEOS-Chem with lightning 6±2 Tg N yr-1 OMI/MLS Tropospheric Ozone OMI/MLS 22% of data GEOS-Chem nolight 6 Tg N yr-1 from lightning -3% bias vs OMI/MLS GEOS-Chem with lightning 6±2 Tg N yr-1 -43% bias vs OMI/MLS ACE-FTS GEOS-Chem nolight Annual average of tropospheric ozone columns at locations and times in which GEOS-Chem simulations yield more than 40% of the tropospheric ozone column from lightning. Acknowledgements This work was supported by NASA’s Radiation Science Program.