Download
1 / 23
230 likes | 364 Views
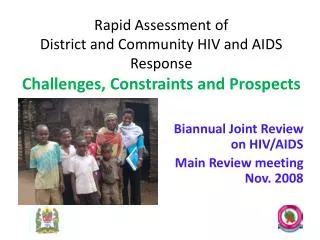
Main messages from EU US Joint Consultative Group Meeting February 2008. Palle Haastrup. Common project since 1997 Meetings once, sometimes twice a year Increased political profile. Ecoinformatics Collaboration since 1997. Introduction. Ecoinformatics and informations systems

E N D
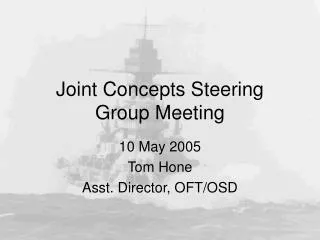
Main messages from EU US Joint Consultative Group Meeting February 2008. Palle Haastrup
Common project since 1997 Meetings once, sometimes twice a year Increased political profile Ecoinformatics Collaboration since 1997
Ecoinformatics and informations systems Environmental and sustainability indicators Formal analysis of uncertainty in environmental models Decision support tools Environment and health Sustainable chemistry and materials Nanotechnology uses and impacts Environmental technologies Emissions from transport and air quality management Key headlines in the implementing arrangement
Political coverage Umbrella Slot on the agenda of the US/EU Joint Consultancy Group Lets use it. What good is the Implementing arrangement ?
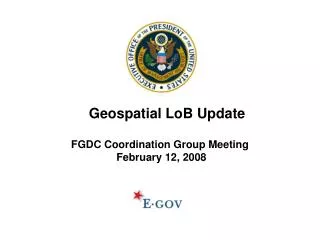
take place annual alternatively in the US and in the EU In 2008 the meeting was chaired by the US State Department (Deputy Assistant Secretary Jeffrey Miotke) DG RTD (Director (D) Mary Minch). The Joint Consultative Group meetings
future internet, deployed infrastructure, network embedded systems, Ecoinformatics Health IT was discussed. Subgroup on ICT
US and EU will work together to attempt to clear up and solve the known issues, Belgian law Consortium contract Funding across the Atlantic Remove barriers to “efficient” collaborations
Consensus that the world is small, common EU US projects are needed “There is only one environment” (yes there are local issues specific to an area, but with communalities across the world). Political climate
Integrate knowledge and data from completely different fields Integrate knowledge from concept systems into indicator construction Make a better overview of surface water quality Use case
Take a concept system Take a database Make a demo Do the following
Concepts from GEMET Data from WISE/Eurowaternet First demo with
GEMET Water -> Water Quality -> Surface Water Quality (ok) Expand: -> Ecological status and Chemical Status -> High, Good, Moderate Expand concept system
Expand again to data elements Ecological status measured by BOD or Nitrogen, or Oxygen contents. So if we have a database with any data elements as these, we can construct the indicator “Ecological Status” into XMDR?
Chemical Status Expand to data elements, pH, next to heavy metals, then into…..
Check contents 10 years data on yearly average of pH, BOD, Oxygen contents,…. Position of measurement station Take waterbase
Take an indicator! High, good, moderate ecological status of surface water. Make the link to data. “High quality” when average BOD5 < 2.5 mg/l, “good” when… Take another indicator, High, good, moderate chemical status. Link pH data: “High” when 6.8 < pH < 7,8 Demo: Enhance environmental indicators by use of concept systems.
Output: Map of positions with water quality status indicator. Aggregating over river basins, and then over countries/states, then over continents, and over the world
From observations of species: example fish. If trout was found in a given river at a given time, the ecological status was “Good”. Put the points on the map! Expand with all potential observationsBiodiversity data!!
What is around the river ? Agriculture ? Human habitats ? Industrial activities ? Industrial agriculture ? Expand into land use
Distribute the water data file from EEA (Palle) Find a good dataset about fish biodiversity observations (Joel, Gail, ??) Expand GEMET with the needed 5-10 concepts (Larry, Bruce ??) Get it into XMDR (Bruce ?) Make the link between the data and the indicator (Palle ?). Produce one set of output (Resources ??). Expand into a common project proposal to EU and US Practical way forward: Make a “micro” demo