Download
1 / 15
150 likes | 251 Views
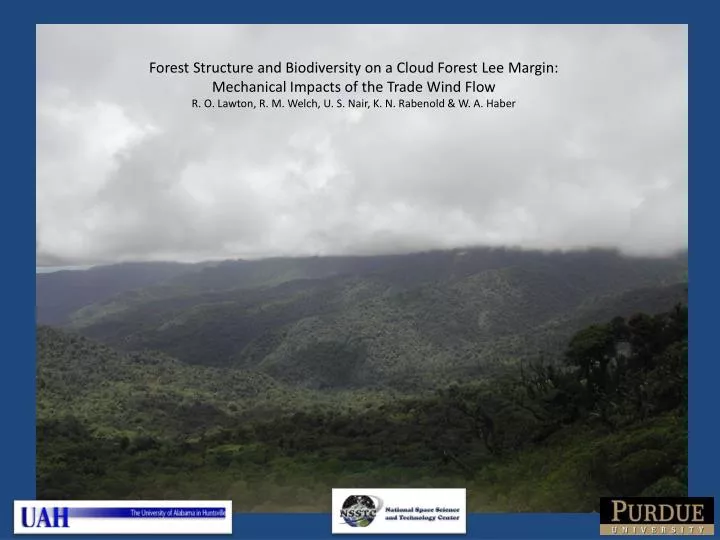
Forest Structure and Biodiversity on a Cloud Forest Lee Margin: Mechanical Impacts of the Trade Wind Flow R. O. Lawton, R. M. Welch, U. S. Nair, K. N. Rabenold & W. A. Haber. What are the causes and correlates of the striking canopy heterogeneity?. A mapped study watershed to examine:

E N D
Forest Structure and Biodiversity on a Cloud Forest Lee Margin: Mechanical Impacts of the Trade Wind Flow R. O. Lawton, R. M. Welch, U. S. Nair, K. N. Rabenold & W. A. Haber
What are the causes and correlates of the striking canopy heterogeneity?
A mapped study watershed to examine: 1) terrain related physiognomic trends 2) patterns of local species distribution in natural terrain units 3) distribution of individuals within populations 4) demographic processes Monteverde study watershed ~12 ha; 1510-1580m 1 ha grid; 5 m contours
17.5 15.0 12.5 Mean canopy height (m) 10.0 7.5 5.0 0 10 20 30 40 50 Distance below ridge crest (m)
25 20 15 Windspeed (km/hr) 10 5 D J F M A M J J A S O N D Month
Ridgetop species: Didymopanax pittieri & Clusia sp. Cove species: Sapium pachstachys & Alchornea latifolia
.4 .3 ridge .2 .1 .3 slope Proportion of species .2 .1 .3 cove .2 .1 .2 .3 .4 .5 .6 .7 .8 .9 1.0 Wood density (gms/cm3)
Trees fall down – a lot. There are many implications. For one, there are many opportunities for shade intolerant tree species.
Spatial segregation of two shade intolerant trees, Cecropia polyphlebia and Guettarda poasana
Angular wavelet analysis of (a) locations of G. poasana individuals and (b) treefall gaps in 2000-2005 in the Monteverde, Costa Rica study watershed indicates strong anisotropy in both patterns. Observed positional variance (solid lines) differs substantially from the means of 99 simulations of isotropic Poisson patterns (dashed lines). Departures from expectation indicate more or less points than expected in a given range of angles.
Interdecadal variation in treefall and forest gap formation prevents a common shade tree, Didymopanax pittieri, from achieving a stable age distribution in natural population units.
So how can we mechanistically scale up from local populations? RAMS – simulated maximum wind speeds 20 m above the ground
All this made possible by a host of characters: NSF, NASA, Wolf Guindon, Eladio Cruz, & the staff of the Monteverde Cloud Forest Reserve, Drs. J. Putz, J. Daniels, R. Welch, U. Nair, R. Pielke, D. Ray, J. Calvo, A. Pounds, W. Haber, K. Rabenold, M. F. Lawton, and students – G. Cauthen, K. Wasmund, T. Earnhardt, T. Field, A. Petroff, P. Petroff, M. Lawton, M. Patrick, N. Lawton, S. Asefi, A. Regmi & V. S. Manoharan