Download
1 / 33
330 likes | 444 Views
A Brief Overview on Some Recent Study of Graph Data . Yunkai Liu, Ph. D., Gannon University. Outlines. Graph Database vs. Traditional Database Data structure Some frequently-used measurements Overview of Graph Databases Graph Data on Social Networks Case study Graph Data on Biology

E N D
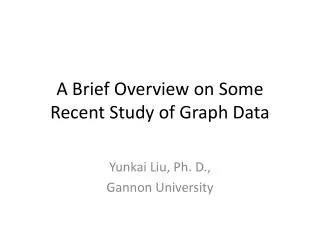
A Brief Overview on Some Recent Study of Graph Data Yunkai Liu, Ph. D., Gannon University
Outlines • Graph Database vs. Traditional Database • Data structure • Some frequently-used measurements • Overview of Graph Databases • Graph Data on Social Networks • Case study • Graph Data on Biology • Case study • Graph Data on other areas
What is the specialty of graph data in application • Basic Data Structure • G = (N, E) • Sometime edges are also named as links • Some difference / limitation • Directed graph • Contains a large amount of attribute categories in nodes • Contains limited amount of attributes categories in edges • Rarely using adjacent matrices; hash table and indices are widely used • Example – SN between us
Some frequently-addressed graph properties • Homophily is the tendency to relate to people with similar characteristics (status, beliefs, etc.) • It leads to the formation of homogeneous groups (clusters) where forming relations is easier • Extreme homogenization can act counter to innovation and idea generation (heterophilyis thus desirable in some contexts) • Homophilousties can be strong or weak
Some frequently-addressed graph properties • Transitivity is a property of ties: if there is a tie between A and B and one between B and C, then in a transitive network A and C will also be connected • Strong ties are more often transitive than weak ties; transitivity is therefore evidence for the existence of strong ties (but not a necessary or sufficient condition) • Transitivity and homophily together lead to the formation of cliques (fully connected clusters) • How to decide reasonable transitivity degree in graph models?
Some frequently-addressed graph properties • Bridges are nodes and edges that connect across groups • Facilitate inter-group communication, increase social cohesion, and help spur innovation • They are usually weak ties, but not every weak tie is a bridge
Some frequently-addressed graph properties -Degree centrality • A node’s (in-) or (out-)degree is the number of links that lead into or out of the node • In an undirected graph they are of course identical • Often used as measure of a node’s degree of connectedness and hence also influence and/or popularity • Useful in assessing which nodes are central with respect to spreading information and influencing others in their immediate ‘neighborhood’
Some frequently-addressed graph properties -Paths • A path between two nodes is any sequence of non-repeating nodes that connects the two nodes • The shortest path between two nodes is the path that connects the two nodes with the shortest number of edges (also called the distance between the nodes) • All shortest paths • K-th shortest path
Some frequently-addressed graph properties – Betweeness centrality • The number of shortest paths that pass through a node divided by all shortest paths in the network • Sometimes normalized such that the highest value is 1 • Shows which nodes are more likely to be in communication paths between other nodes • Also useful in determining points where the network would break apart.
Some frequently-addressed graph properties – Closeness centrality • The mean length of all shortest paths from a node to all other nodes in the network (i.e. how many hops on average it takes to reach every other node) • It is a measure of reach, i.e. how long it will take to reach other nodes from a given starting node • Useful in cases where speed of information dissemination is main concern • Lower values are better when higher speed is desirable
Some frequently-addressed graph properties – Eigenvector centrality • A node’s eigenvector centrality is proportional to the sum of the eigenvector centralities of all nodes directly connected to it • In other words, a node with a high eigenvector centrality is connected to other nodes with high eigenvector centrality • This is similar to how Google ranks web pages: links from highly linked-to pages count more • Useful in determining who is connected to the most connected nodes
Others measurements • Reciprocity (degree of) • The ratio of the number of relations which are reciprocated (i.e. there is an edge in both directions) over the total number of relations in the network • A useful indicator of the degree of mutuality and reciprocal exchange in a network, which relate to social cohesion • Only makes sense in directed graphs
Others measurements • Density • A network’s density is the ratio of the number of edges in the network over the total number of possible edges between all pairs of nodes (which is n(n-1)/2, where n is the number of vertices, for an undirected graph) • It is a common measure of how well connected a network is (in other words, how closely knit it is) –a perfectly connected network is called a clique and has density=1 • A directed graph will have half the density of its undirected equivalent, because there are twice as many possible edges, i.e. n(n-1) • Density is useful in comparing networks against each other, or in doing the same for different regions within a single network
Others measurements • Clustering • A node’s clustering coefficient is the density of its neighborhood(i.e. the network consisting only of this node and all other nodes directly connected to it) • The clustering coefficient for an entire network is the average of all coefficients for its nodes • Clustering indicative of the presence of different (sub-)communities in a network
Others measurements • Average and longest distance • The longest shortest path (distance) between any two nodes in a network is called the network’s diameter • It also indicates how long it will take at most to reach any node in the network (sparser networks will generally have greater diameters) • The average of all shortest paths in a network is also interesting because it indicates how far apart any two nodes will be on average (average distance)
What is Graph Database • Graph database started in 1970s • It is growing fast recently due to the development of computer science tech. • Some GD claimed that they can represent millions of nodes and billions of edges • GD is a part of NoSQL database
Social Network Analysis (SNA) • News • In 2013 Feb, Facebook announced their new “graph search” app • Major questions • Networks: How to represent various social networks • Tie Strength: How to identify strong/weak ties in the network • Key Players: How to identify key/central nodes in network • Cohesion: How to characterize a network’s structure • Major application • Social study • National security • Micro-advertisement • …
Some of my project • Meth-Hunter • Graph Data Management system • Graph Data warehouse protocol
Graph Data in Biology • Multiple classes of bionetwork models exist, such as metabolic, protein-gene, or protein-protein interactions • Metabolic networks entail nodes as metabolites and edges as enzymes facilitating a specific reaction within the body or nature. • Protein-gene interactions involve understanding and mapping gene expression. • As with metabolic and gene expression, protein-protein interaction networks include nodes as proteins
Graph Data in Biology • The structure of bio-network is important for us to understand the nature • The analysis part is similar with SNA, • The clique-finding is important and it may related with tumar.
One case study – bionetwork alignment • Two previous models include Graemlin (General and robust alignment of multiple large interaction networks) and PHUNKEE (Pairing subgrapHs Using NetworK Environment Equivalence) • As Graemlin considers the entire network spectrum, the PHUNKEE algorithm considers only the most conserved portions between two graphs
One case study – bionetwork alignment • Graemlinwas advantageous in that it could align multiple networks at a fast pace, however; all nodes and edges are considered whether or not they are similar to each other. • On the contrary, PHUNKEE considers only the most conserved portions of two graphs, taking into account that insertions and deletions may occur over time. However, the algorithm performs slowly, working in a step-by-step manner.
One case study – bionetwork alignment • we realized that one method is not enough to determine the relationship between two graphs because of various factors from data. Thus, we create a comprehensive package for pairwise graph comparison. • The package includes two interfaces; one is for global alignment and another for local alignment. • Transitivity property is also considered in case of missing nodes or missing edges.
A Cladogram for Rattusnorvegicus, Musmusculus and Saccharomyces cerevisiae
Some Weird Part • The normalization of the data is a big challenge. It is easy to get a wrong conclusion, which is yeast is more close to human than mice. • It is just an example of graph mining in bioinformatics
Other area of Graph Data • GIS • Financial / business • Public spending • Gaming • Some challenges of GD in CS • Cloud app and cloud computing • Visualization • Integrating with other databases