Download
1 / 11
110 likes | 236 Views
%ejemplo2.1pp13 %generar la secuencia x(n)=2delta(n+2) - delta(n-4) %dentro del intervalo -5 <= n <= 5 n = [-5:5]; x = 2*impseq(-2,-5,5) - impseq(4,-5,5); stem(n,x) title( 'Secuencia x(n)=2delta(n+2) - delta(n-4)' ) xlabel( 'n' ) ylabel( 'x(n)' ). %ejemplo2.1bpp14 %generar la secuencia

E N D
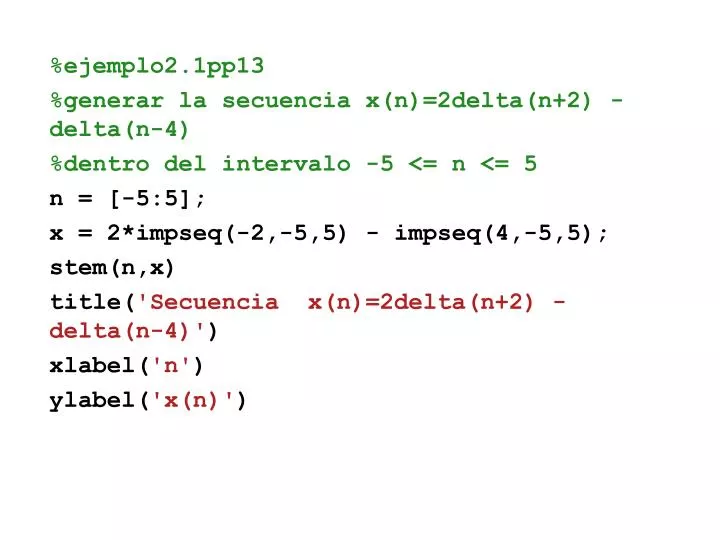
%ejemplo2.1pp13 %generar la secuencia x(n)=2delta(n+2) - delta(n-4) %dentro del intervalo -5 <= n <= 5 n = [-5:5]; x = 2*impseq(-2,-5,5) - impseq(4,-5,5); stem(n,x) title('Secuencia x(n)=2delta(n+2) - delta(n-4)') xlabel('n') ylabel('x(n)')
%ejemplo2.1bpp14 %generar la secuencia %x(n)=n[u(n) - u(n-10)]+10exp{-0.3(n-10)}[u(n-10) - u(n-20)] %dentro del intervalo 0 <= n <= 20 n = [0:20]; x1 = n.*(stepseq(0,0,20) - stepseq(10,0,20)); x2 = 10*exp(-0.3*(n-10)).*(stepseq(10,0,20) - stepseq(20,0,20)); x = x1 + x2; %subplot(2,2,3); stem(n,x) title('Secuencia n[u(n) - u(n-10)]+10exp{-0.3(n-10)}[u(n-10) - u(n-20)]') xlabel('n') ylabel('x(n)')
%ejemplo2.1cpp14 %generar la secuencia %x(n)=cos(0.04pi*n) + 0.2w(n) %dentro del intervalo 0 <= n <= 50 n = [0:50]; x1 = cos(0.04*pi*n); x2 = 0.2*rand(size(n)); x = x1 + x2; %subplot(2,2,3); stem(n,x) title('Secuencia x(n)=cos(0.04pi*n) + 0.2w(n)') xlabel('n') ylabel('x(n)')
%ejemplo2.1dpp15 %generar la secuencia %x(n)={...,5,4,3,2,1,5,4,3,2,1,5,4,3,2,1,...} %dentro del intervalo -10 <= n <= 9 n = [-10:9]; x = [5,4,3,2,1]; xtilde = x'*ones(1,4); xtilde = (xtilde(:))'; %subplot(2,2,3); stem(n,xtilde) title('Secuencia x(n)={...,5,4,3,2,1,5,4,3,2,1,5,4,3,2,1,...}') xlabel('n') ylabel('x(n)')
% UNIVERSIDAD AUTONOMA DE PUEBLA % % Script que sirve para generar una señal valuada compleja % x(n) = exp{(-0.1+0.3j)n} % Grafica de Parte Real, la Parte Compleja % Magnitud y Fase de x(n) n=[-10:1:10]; alpha=-0.1+0.3j; x=exp(alpha*n); subplot(2,2,1); stem(n,real(x));
title('Parte Real') xlabel('n') ylabel('Amplitud') subplot(2,2,2); stem(n,imag(x)); title('Parte Imaginaria') xlabel('n') ylabel('Amplitud') subplot(2,2,3); stem(n,abs(x)); title('Magnitud') xlabel('n') ylabel('Amplitud') subplot(2,2,4); stem(n,(180/pi)*angle(x)); title('Fase') xlabel('n') ylabel('Amplitud')
% ejemplo24pp18 % SCRIPT QUE SIRVE PARA OBTENER LA DESCOMPOSICION % DE UNA SEÑAL % x(n) = u(n) - u(n-10); % EN SUS COMPONENTES PAR E IMPAR n=[0:10]; x=stepseq(0,0,10)-stepseq(10,0,10); [xe,xo,m]=evenodd(x,n); figure(1) clf subplot(2,2,1); stem(n,x); title('Pulso Rectangular') xlabel('n') ylabel('Amplitud de x(n)') axis([-10,10,0,1.2]);
subplot(2,2,2); stem(m,xe); title('Componente Par del Pulso Rectangular') xlabel('n') ylabel('Amplitud de xe(n)') axis([-10,10,0,1.2]); subplot(2,2,4); stem(m,xo); title('Componente Impar del Pulso Rectangular') xlabel('n') ylabel('Amplitud de xo(n)') axis([-10,10,-0.6,0.6]);
% ejemplo25pp23 % SCRIPT QUE SIRVE PARA OBTENER LA CONVOLUCION % DE LAS SEÑALES % x(n) = u(n) - u(n-10); (SEÑAL DE ENTRADA AL SISTEMA) % h(n) = (0.9)^n * u(n); (RESPUESTA AL IMPULSO DEL SISTEMA) %% GRAFICA DE LA SEÑAL DE ENTRADA x(n) n=[-5:50]; x=stepseq(0,-5,50) - stepseq(10,-5,50); subplot(2,1,1) stem(n,x) u=stepseq(0,0,50); h=(0.9).^n; %h=sigmul(h,length(h),u,length(u)); subplot(2,1,2) stem(n,h) y=conv(x,h);
x=[3 11 7 0 -1 4 2]; h=[2 3 0 -5 2 1]; nx=[-3:3]; nh=[-1:4]; [y,ny]=conv_m(x,nx,h,nh); y ny
% GENERADOR SE UNA SECUENCIA DE RUIDO OPCION 1 x=[3,11,7 0 -1 4 2]; nx=[-3:3]; [y,ny]=sigshift(x,nx,2); %obtiene x(n-2) w=randn(1,length(y)); %genera el ruido w(n) nw=ny; [y,ny]=sigadd(y,ny,w,nw); %obtiene y(n) = x(n-2) + w(n) [x,nx]=sigfold(x,nx); [rxy,nrxy]=conv_m(y,ny,x,nx); %obtiene la correlacion cruzada stem(nrxy,rxy); axis([-5,10,-50,250]); title('CORRELACION CRUZADA: SECUENCIA DE RUIDO 1') xlabel('atraso de la variable') ylabel('rxy')