Download
1 / 10
100 likes | 183 Views
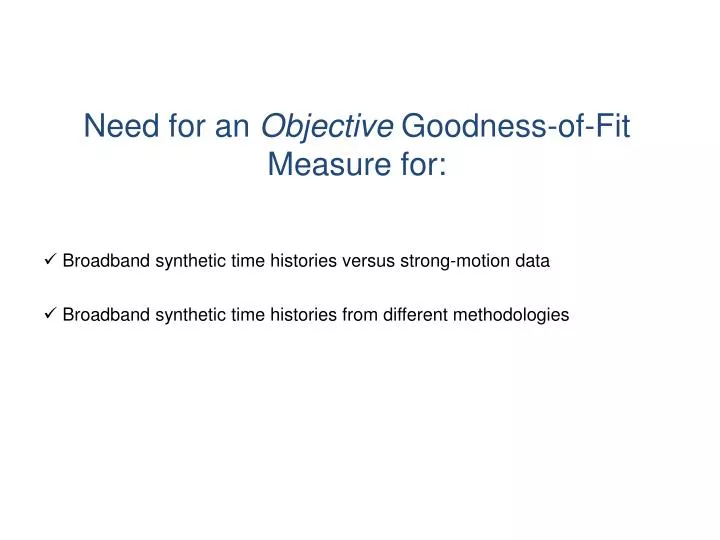
Need for an Objective Goodness-of-Fit Measure for:. Broadband synthetic time histories versus strong-motion data. Broadband synthetic time histories from different methodologies.

E N D
Need for an Objective Goodness-of-Fit Measure for: • Broadband synthetic time histories versus strong-motion data • Broadband synthetic time histories from different methodologies
Kim B. Olsen and John E. Mayhew: Goodness-of-fit Criteria for Broadband Synthetic Seismograms, with Application to the 2008 Mw 5.4 Chino Hills, Califonia, Earthquake, Seismological Research Letters 80(6): 1002-1007
GOF Approach: Combination of Different Metrics Time-domain Metrics: Cross-Correlation (Waveform Comparison) Peak Acceleration (PGA) Peak Velocity (PGV) Peak Displacement (PGD) Cumulative Energy Spectral Metrics: Smoothed Fourier Amplitude Amplitudes Average Response Spectra (0.1-10s) Spectral Accelerations at NGA Periods Duration at Selected Periods Inelastic/Elastic Ratios (I/E)
The Goodness-of-fit Scale 100 90 80 70 60 50 40 30 20 10 0 Try Again 1 2 3
Visual Confirmation of GOF Values GOFPGV=82 GOFPGV=19 GOFFS=51 GOFFS=11 GOFRS=75 GOFRS=14
Weights • User supplies a list of weights (wi) • Normalized weights are applied to each metric GOF value (m i) for the overall site and component GOF values
New: map-based GOF PGA IE 0.2-0.5s SA-0.2s IE 0.75-2.5s SA-2s IE 2-5s
IE ratios derived from data (gray) and synthetics (black) for the 2008 Chino Hills earthquake. Dots are results from 33 stations, and the solid lines are the corresponding mean values.