Download
1 / 6
60 likes | 164 Views
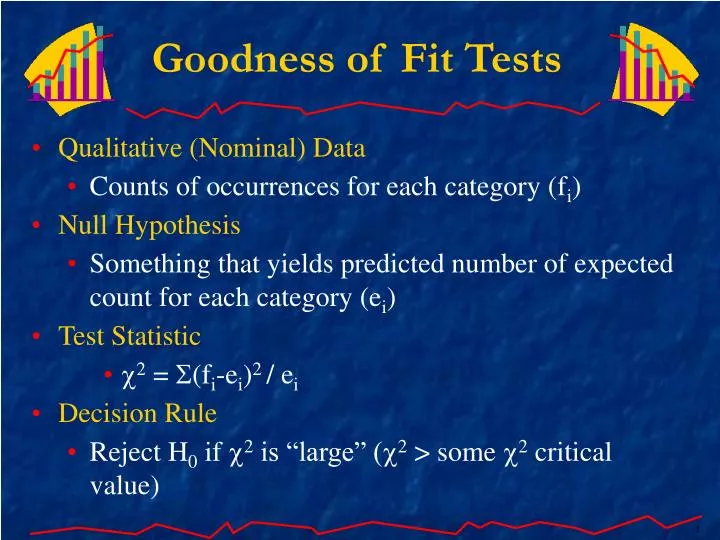
Goodness of Fit Tests. Qualitative (Nominal) Data Counts of occurrences for each category (f i ) Null Hypothesis Something that yields predicted number of expected count for each category (e i ) Test Statistic 2 = ( f i -e i ) 2 / e i Decision Rule

E N D
Goodness of Fit Tests • Qualitative (Nominal) Data • Counts of occurrences for each category (fi) • Null Hypothesis • Something that yields predicted number of expected count for each category (ei) • Test Statistic • 2 = (fi-ei)2 / ei • Decision Rule • Reject H0 if 2 is “large” (2 > some 2 critical value)
2 Distribution Specific skewness depends on degrees of freedom 5 d.f 10 d.f 15 d.f 0
2 Distribution 10 d.f P(2 > ) = 0.05 P(2 < ) = 0.95 0 ?
Equality of Percentages Example • An HR manager wants to know whether 30% of the workers are very satisfied, 30% are somewhat satisfied, 20% are indifferent, and 20% are quite unhappy with their jobs. It is your job to determine the answer, but you only have the resources to question 300 workers. What do you tell the HR manager (assume a 5% level of significance)? • From a random survey of 300 workers, you tabulate the following: Number of workers very satisfied 76 somewhat satisfied 100 indifferent 76 unhappy 48
Independent Events Example • You want to know whether race is related to the shift that the worker is working. An intern sample 228 workers in the factory and classifies them as follows: Shift 1Shift 2Shift 3 White 42 28 16 Non-white 44 57 41 • Can you conclude that race and shift are related (i.e., not independent)? (use = 0.05)