Download
1 / 20
220 likes | 294 Views
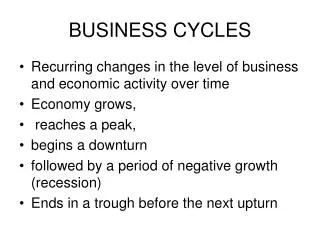
Business Cycles. A business cycle is a macroeconomic period of expansion followed by a period of contraction. A modern industrial economy experiences cycles of goods times, then bad times, then good times again.

E N D
Business Cycles A business cycle is a macroeconomic period of expansion followed by a period of contraction. • A modern industrial economy experiences cycles of goods times, then bad times, then good times again. • Business cycles are of major interest to macroeconomists, who study their causes and effects. • There are four main phases of the business cycle: expansion, peak, contraction, and trough. • Businesses reduce their capital expenditures when they decide they have expanded enough. • At the first sign of an economic slowdown, they cut back inventories, cut back working hours, and start laying off workers. New investment is cancelled. • Government money policy can also affect the cycle. • External shocks, like war or an increase in oil prices, can cause business cycles.
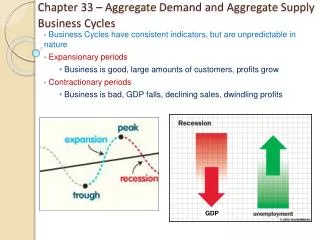
Business Cycle Phases Expansion--a period of economic growth as measured by a rise in real GDP. Economic growth is a steady, long-term rise in real GDP. Peak--when real GDP stops rising, the economy has reached its peak, the height of its economic expansion. Contraction--Following its peak, the economy enters a period of contraction, an economic decline marked by a fall in real GDP. A recession is a prolonged economic contraction. It is usually defined as GDP decline for TWO successive quarters. An especially long or severe recession may be called a depression. Trough--is the lowest point of economic decline, when real GDP stops falling.
4 Variables that Keep the Business Cycle Going • Business Investment--When an economy is expanding, firms expect sales and profits to keep rising, and therefore they invest in new plants and equipment. This investment creates new jobs and furthers expansion. In a recession, the opposite occurs. • Interest Rates and Credit--When interest rates are low, companies make new investments, often adding jobs to the economy. When interest rates climb, investment dries up, as does job growth. • Consumer Expectations--Forecasts of a expanding economy often fuel more spending, while fears of recession tighten consumers' spending. • External Shocks--External shocks, such as disruptions of the oil supply, wars, or natural disasters, greatly influence the output of an economy. WAR is bad for markets!
Forecasting Business Cycles • Economists try to forecast, or predict, changes in the business cycle. • Leading indicators are key economic variables economists use to predict a new phase of a business cycle. • Examples of leading indicators are stock market performance, interest rates, and new home sales.
Business Cycle Fluctuations The Great Depression • The Great Depression was the most severe downturn in the nation’s history. • Between 1929 and 1933, GDP fell by almost one third, and unemployment rose to about 25 percent. Later Recessions • In the 1970s, an OPEC embargo caused oil prices to quadruple. This led to a recession that lasted through the 1970s into the early 1980s. U.S. Business Cycles in the 1990s • Following a brief recession in 1991, the U.S. economy grew steadily during the 1990s, with real GDP rising each year. In late 2000, as the Clinton administration was leaving, the US began to enter a recession that Bush has been blamed for.
Remedying the Business Cycle • The Government can try to regulate the business cycle by applying Keynesian Economics. • John Maynard Keynes handout • But there is a lag—Congress cannot agree on a stimulus package, partisan bickering • You almost have to pass a job creation stimulus package DURING GOOD TIMES. Of course, the risk then becomes inflation. Now do you want Alan Greenspan’s job?
Section Review—Business Cycles 1. A business cycle is (a) a period of economic expansion followed by a period of contraction. (b) a period of great economic expansion. (c) the length of time needed to produce a product. (d) a period of recession followed by depression and expansion. 2. A recession is (a) a period of steady economic growth. (b) a prolonged economic expansion. (c) an especially long or severe economic contraction. (d) a prolonged economic contraction.
Types of Inflation Creeping Inflation • Creeping inflation is inflation that remains low (1 to 3 percent) for a long time. Chronic Inflation • Chronic inflation occurs when the inflation rate rises steadily from month to month over an extended period. Hyperinflation • Hyperinflation is inflation that is growing out of control. Inflation rates may be as high as 100 or even 500 percent. Hyperinflation can sometimes lead to total economic collapse. EX: Germany 1923 Deflation is where prices fall. It’s negative inflation.
Causes of Inflation • The Quantity Theory-- states that too much money in the economy leads to inflation. Adherents to this theory maintain that inflation can be tamed by increasing the money supply at the same rate that the economy is growing. • The Cost-Push Theory--Inflation occurs when producers raise prices in order to meet increased costs. Cost-push inflation can lead to a wage-price spiral — the process by which rising wages cause higher prices, and higher prices cause higher wages. • The Demand-Pull Theory--states that inflation occurs when demand for goods and services exceeds existing supplies.
But what explains “Stagflation?” • During Nixon administration, “Stagflation” occurred. • It was the combination of inflation with no economic growth. • The inflation theories do not account for this possibility—but it did happen.
Effects of Inflation High inflation is a major economic problem, especially when inflation rates change greatly from year to year. • Purchasing Power--In an inflationary economy, a dollar loses value. It will not buy the same amount of goods that it did in years past. Some people start speculating and their purchasing drives prices even higher. It’s like a stock market full of short sellers. • Interest Rates--When a bank's interest rate matches the inflation rate, savers break even. When a bank's interest rate is lower than the inflation rate, savers lose Real money. • Income--If wage increases match the inflation rate, a worker's real income stays the same. If income is fixed income, or income that does not increase even when prices go up, the economic effects of inflation can be harmful. The elderly take a beating.
Inflation Group Check-up Questions • Define inflation precisely. • What are the effects of rising prices? • How is the inflation rate calculated? • What are the three types of inflation? • What are the causes and effects of inflation? • Who wins and who loses because of inflation?
Section Review--Inflation 1. Inflation is • (a) the process by which rising wages cause higher prices. • (b) the price increase of a typical group of goods. • (c) a general increase in prices. • (d) the ability to purchase goods and services. 2. Chronic inflation occurs when the inflation rate • (a) drops to zero. • (b) remains low for a long time. • (c) grows out of control. • (d) rises steadily over an extended period.
Poverty The Census Bureau collects data about how many families and households live in poverty. The Poverty Threshold • The poverty threshold is an income level below which income is insufficient to support a family or household. $16,000 for a family of 4. • The Poverty Rate • The poverty rate is the percentage of people in a particular group who live in households below the official poverty line. 13% of Americans are poor. Yet, the poorest Americans are often better of than the average person in a 3rd world country
Poverty: Focus Questions • Who is poor, according to government standards? • What causes poverty? • How is income distributed in the United States? • What government programs are intended to combat poverty? • Should these programs be discontinued or reformed?
Causes of Poverty • Lack of Education--The median income of high-school dropouts in 1997 was $16,818, which was just above the poverty line for a family of four. • Location --On average, people who live in the inner city earn less than people living outside the inner city. • Shifts in Family Structure--Increased divorce rates result in more single-parent families and more children living in poverty. Dan Quayle: “Marriage is probably the best anti-poverty program of all.” • Economic Shifts--Workers without college-level skills have suffered from the ongoing decline of manufacturing, and the rise of service and high technology jobs. • Racial and Gender Discrimination--Some inequality exists in wages between whites and minorities, and men and women. • Differences in wealth lead to differences in income.
Income Distribution Income Inequality • The Lorenz Curve illustrates income distribution. Income Gap • A 1999 study showed that the richest 2.7 million Americans receive as much income after taxes as the poorest 100 million Americans. • Differences in skills, effort, and inheritances are key factors in understanding the income gap. Monopoly power also allows some groups, like doctors and lawyers, to maintain high incomes.
The Lorenz Curve • The Lorenz curve was developed by Max O. Lorenz as a graphical representation of income inequality. It can also be used to measure inequality of assets or other distributions. • In economics, we frequently make statements such as, "the bottom twenty percent of all households have five percent of the total income". The Lorenz curve is based on such statements; every point on the curve represents one such statement. • The Lorenz curve is a graph that shows, for the bottom x% of households, the percentage y% of the total income which they have.. • A perfectly equal society would be one in which every person has the same income. In this case, the bottom N% of society would always have N% of the income. Thus a perfectly equal society can be depicted by the straight line y=x; we call this line the line of perfect equality. • A perfectly inequal society, by contrast, would be one in which one person has all the income and everyone else has none. In that case, the curve would be at y=0 for all x<100, and y=100 when x=100. We call this curve the line of perfect inequality. • It is impossible for the Lorenz curve to rise above the line of perfect equality, or sink below the line of perfect inequality. • The Lorenz curve is used to calculate the Gini coefficent.
Government Programs that Fight Poverty • Employment Assistance--the minimum wage and federal and state job-training programs aim to provide people with more job options. • General Assistance—food stamps • Welfare Reform--Temporary Assistance for Needy Families (TANF) is a program which gives block grants to the states, allowing them to implement their own assistance programs. Workfare programs require work in exchange for temporary assistance. There is a 5-year limit on the receipt of benefits. These provisions are in the 1996 Welfare Reform Act. • Enterprise Zones—provide jobs in poor neighborhoods by encouraging companies to set up shop in low-tax or no-tax zones. • Social Service Programs—provide assistance with family planning, child abuse prevention and other problems affecting low income people
Section Review--Poverty 1. An income level below which income is insufficient to support a family or household is known as the • (a) income gap. • (b) poverty rate. • (c) poverty threshold. • (d) income inequality. 2. The Personal Responsibility and Work Opportunity Act of 1996 • (a) provides lump sums of money to poor families. • (b) provides federal payments to poor families to supplement state payments. • (c) set a 5-year limit on receipt of benefits. • (d) provides direct cash payments to poor families.