Download
1 / 41
440 likes | 813 Views
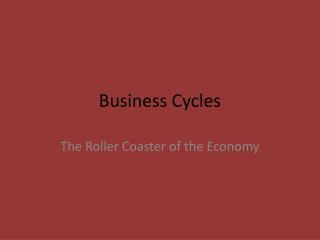
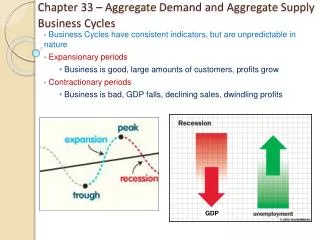
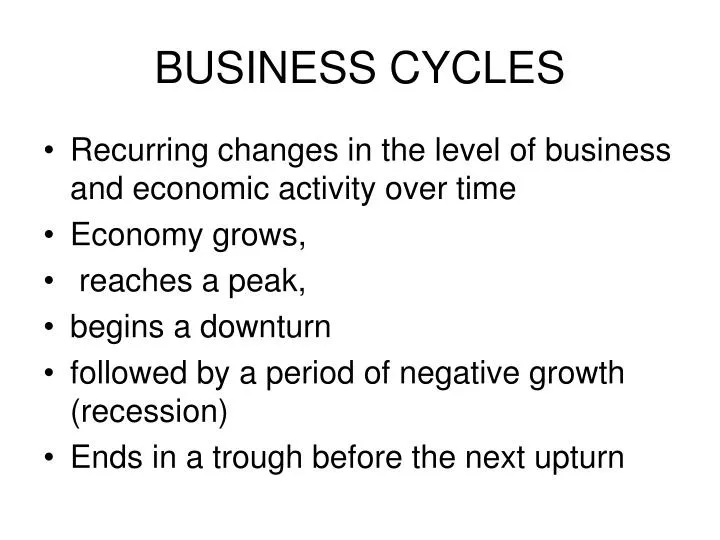
BUSINESS CYCLES. Recurring changes in the level of business and economic activity over time Economy grows, reaches a peak, begins a downturn followed by a period of negative growth (recession) Ends in a trough before the next upturn. To be considered a cycle, NBER has 4 Factors

E N D
BUSINESS CYCLES • Recurring changes in the level of business and economic activity over time • Economy grows, • reaches a peak, • begins a downturn • followed by a period of negative growth (recession) • Ends in a trough before the next upturn
To be considered a cycle, NBER has 4 Factors 1. Depth and Rebound (Amplitude): Economic activity must show a significant decline followed by a rebound • Length of Recessions and Recovery (Duration Should be at least one year (to avoid any seasonal fluctuations)
3.Impact on the Economy (Diffusion) Must be broadly based throughout many industries and economic activities • Displacement and Utilization Classify the cycle by degree of severity or strength
Measures the degree of disruption from recessions and degree of utilization from expansions 2 common displacement measures: Unemployment & capital utilization • Business Cycle Dating Committee of the NBER delineates business cycles in the US
A second NBER definition is • Deviation cycle • Or • More commonly, Growth cycles Growth cycle is a significant deviation around the trend rate of change Short term fluctuations in aggregate economic activity Must meet the same duration criteria applied to business cycles
Measuring Business Cycles • The BC is analyzed by the following procedures: • NBER = A growth cycle method • Shumpeter = An equilibrium points method • EPA (Economic Planning Agency) = Diffusion Index • Australian Deviation cycle = high and low growth rates
BOOM Slowdown Expansion slowdown P S S Trend G E T E dec inc Normal lower bound Recession
Example: • Product sales rarely grow in a constant fashion • There may be an underlying trend but • There are likely to be deviations from this trend • Deviations could be the result of cycles in the data
MSV Schumpeter above Upswing phase Recession Phase Equilibrium Inflection point Inflection point Inflection point be l ow Revival Depression phase
Each phase is defined as follows: • Recession: A period of decline in aggregate economic activity lasting at least one year with widely diffused effects on the economy Recovery: A rebound period in aggregate activity characterized by relative stable prices, expanding output and productivity
Cycles will always occur so we need to work out ways of • predicting the timing, • predicting the amplitude • Providing suitable planning responses from a corporate point of view
Why Cycles? Because of the existence of a lag between a force and the response to that force Lags in business and economic forces and the response to those forces e.g. Change in demand level and corporate response in terms of higher output
Demand increases • Business executive may not recognize change immediately • May be reluctant to change output unless she knows that demand will endure • Takes time for production to fully adjust to demand • In the meantime, stock levels have dropped • Production will have to rise further to build stocks back up
The lag between action and reaction continues to apply • It takes time for production to react to the satisfactory levels of stock • By the time production returns to satisfactory level, stocks are way up. • So production is reduced below demand to reduce stock • Back to original situation and cycle repeats itself again
5 Types of cycles • Agricultural or Cobweb Cycles • Inventory or Kitchin Cycles • Fixed Investments or Juglar cycles • Building or Kuznets Cycles • Kondratieff Cycles
Agricultural or Cobweb cycles • Best known sector cycle in economics • Cobweb pattern – Nicholas Kaldor • Regular fluctuations occur in agricultural production because • The following period’s production is determined by current or past prices • The current price is determined by current production
Inventory or Kitchin or Metzler Cycles • Inventory fluctuations are caused by holding of inventories. • We hold inventories to: • Smooth production • Product more cost-effective lot sizes • To buffer stock and prevent lost sales due to insufficient stock • To take advantage of lower prices
Metzler’s Model • Assumption: • System is in equilibrium • MPC = 0.6 • Income = production for expected sales, inventories and investment • In current period, desired inventories are equal to a difference between actual and expected sales in the preceding period
Metzler’s Conclusion • Total income approaches equilibrium • Inventories lag behind income
Fixed Investment Cycles or Juglar Cycles • Clement Juglar analyzed a behaviour of fixed investments • Fixed investments = business expenditures on equipments and structures • Conclusion: • Fixed investment has a longer life than inventories. • Fixed investment cycles is from 7 – 11 years
Building cycle or Kuznet cycle (construction cycle) • Both short term (tied to credit markets) and • Long term (tied to functions of demographics) • Building cycle was constructed to understand the phases of the real estate cycle (which is very important for investment)
Story: • During economic booms, demand for labour increases which in turn puts pressure on wages • Increased economic activity causes new family formations • Sparks the demand for new housing units • Boosts the economic output more • Process begins again
Building cycle has 4 phased • Development: Demand picks up, and housing starts follows. Low vacancy rates and rising rents. Reaches maturity after about 3 – 5 years Aggressive bidding up of land prices is a turning point
Overbuilding: Housing sales outpaces home sales • Adjustment Builders react to declining sales and curtails housing starts
Acquisition: Housing starts continue to decline. home sales are still firm Building activity is further reduced though vacancy rates have peaked
Kondratieff Cycles (Long Wave cycles) • Long wave cycles with durations of 45 and 60 years. • 4 Long wave theories in economic development • Shumpeter’s three-cycles schema • Forrester’s System Dynamics • Burns and Mitchell’s cycle of cycles • Rostow’s Stages of Long term growth
Forecasting Cycles • Several methods to predict turning points • Cyclical Indexes using the decomposition method • Econometric and MARIMA models • Use of Composite Index based on business indicators • Pressure cycles
Cyclical indexes • Cyclical component is the wave-like movement along the long-term trend • Measure by the Cyclical Factors in the decomposition method • CF = Y/ TSI = • Actual data divided by Trend, Seasonal and Irregular • CMA / CMAT
A CF > 1 a deseasonlized value above long term trend. • Very difficult to analyze and forecast but can give insights into where an cyclical variable is headed. • Check the length and amplitude of the cycle and that may help you predict the next turning point.
Pay attention to periodicity and amplitude and make a projection. • 1st Peak = July 1976 (Q3) • Trough=Jan 1979 (Q1) • Amplitude = 10 quarters • 2nd peak, trough = July 1981 (Q3), Jan 86 (Q1) 18 quarters • 3rd peak, trough = July 90 (Q3), Jan 95 (Q1) 18 quarters
Average period between peak and trough is 15.3 quarters with a standard deviation of 4.6 • Last peak was April 2003 (Q2) so expect a trough sometime around Oct 2005 (Q4) (about 10 quarters later)
Using Business Indicators • Operates usual up to 12 months ahead • Aim to anticipate turning points by Constructing a series which displays maxima and minima some months ahead, as the data series you wish to forecast Leading Indicators
Three classes of business Indicators: • Leading Indicators • Co-incident indicators • Lagging Indicators
Leading Indicators These indicators forecast the timing of turning points not the magnitude of upswing or downswing. Used to help anticipate turning points They are used for event-timing forecasting
e.g. Stock building is an important factor in describing the cyclical movement in industrial production Interest rates lead stock building in the economy • Interest rates is a leading indicator of industrial production We don’t rely on one time series but number of time series which have properties of leading indicators and form an index out of them
This guards against one series not giving the right information at the turning point • Coincident Indicators These indicators measure how the economy (variable) is currently performing. An index is also the best measure
Lagging Indicators Lags behind the general state of the economy (Variable) both on the up and down. A composite index is also computed for this • Leading indicators change directions ahead of turns in the variable • Coincident turn at about the same time as the variable • Lagging follows the variable
Selection of Leading Indicators • Economic significance: must be backed by economic theory • Statistically adequate: Series should not be frequently or heavily revised • Historical conformity with business cycle: Consistent patterns of rise and fall in line with the business cycle
4. Cyclical timing records as leaders: Must have be consistent as a leader • Smoothness: Data series must be smooth for turning points to be easily identified • Promptness of publication: It is of no use creating an indicator with a lead of 12 months if the data is published a year after the event.