Download
1 / 42
450 likes | 819 Views
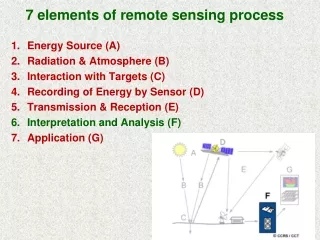
7 elements of remote sensing process. Energy Source (A) Radiation & Atmosphere (B) Interaction with Targets (C) Recording of Energy by Sensor (D) Transmission & Reception (E) Interpretation and Analysis (F) Application (G). Extract meaningful information from imagery.

E N D
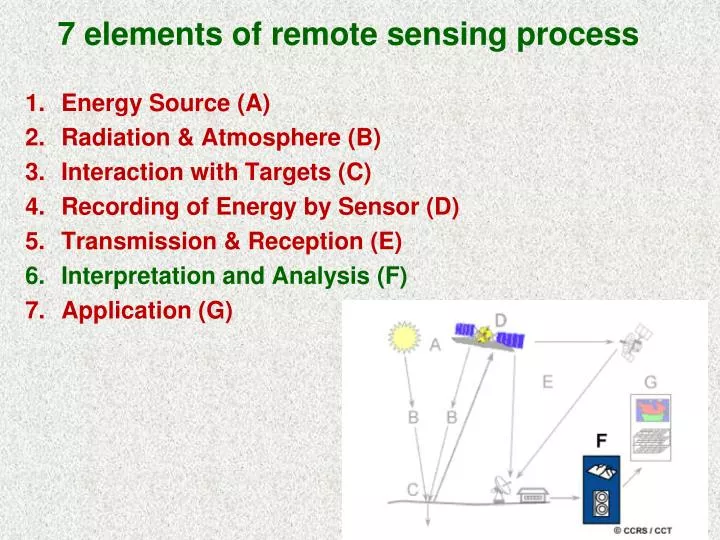
7 elements of remote sensing process • Energy Source (A) • Radiation & Atmosphere (B) • Interaction with Targets (C) • Recording of Energy by Sensor (D) • Transmission & Reception (E) • Interpretation and Analysis (F) • Application (G)
Extract meaningful information from imagery 6. Interpretation and Analysis (F) - the processed image is interpreted, visually and/or digitally, to extract information about the target which was illuminated.
4.3 Digital Image Processing Common image processing image analysis functions: A. Preprocessing B. Image Enhancement C. Image Transformation D. Image Classification and Analysis
Background • DIP - manipulation & interpretation of images • Began in 1960’s • 1972 - Landsat 1 launched • Access to low cost, efficient computers • Access to imagery
Analog and digital signals - used to transmit information (electric signals). • In both – information (audio or video), is transformed into electric signals. • Difference • analog - information is translated into electric pulses of varying amplitude. • digital - information is translated into binary format (zero or one) where each bit is representative of two distinct amplitudes.
Pixel Digital spatial image - made up of a grid of cells, each containing a value or measurement and representing an area of the Earth’s surface.
Digital Number (DN) - value stored within a pixel of an image, represents amount of light reflected back to sensor. digital format – images are represented in a computer as arrays of pixels.
Multispectral images - multiple layers representing different parts of the EMS.
4.2 Elements of Visual Interpretation • Identifying targets • Based on how they reflect/emit radiation • Based on; • Visual elements – tone, shape, pattern, texture, shadow, association.
4.3 Digital Image Processing Common image processing image analysis functions: A. Preprocessing B. Image Enhancement C. Image Transformation D. Image Classification and Analysis
1. Pre-Processing (Image Rectification) • Initial processing of raw data prior for analysis • Correct for distortion due to characteristics of imaging system & imaging conditions.
1. Pre-Processing (Image Rectification) • Procedures include:a. geometric correction- correct for geometric distortion due to Earth's rotation, curvature, platform motion, relief displacement, (such as oblique viewing). b. radiometric correction- correct for uneven sensor response over image, random noise, atmosphere.c. geo-referencing - ground control points (GCP's) used to register image to a precise map.
2. Image Enhancement • Solely to improve appearance of imagery. • Increasing visual distinction • Un-enhanced images usually appear very dark - little contrast - difficult to visually interpret. • Various procedures applied to image data in order to more effectively display data for visual interpretation.
2. Image Enhancement A. Contrast stretching • Histograms • Increase tonal distinction B. Spatial filtering • Enhance/suppress features
A. Contrast stretching • Radiometric enhancement - manipulate brightness and contrast of pixels to amplify differences between features. • Changes made to pixels without consideration of values of surrounding pixels. • adjust brightness and contrast controls • apply preset contrast stretches • manually adjusting image histograms
A. Contrast stretchingRadiometric Enhancement • Not all values will be used or spread out to fill the entire range of 256 values. • Need to manipulate the relative brightness and contrast of the pixels to amplify the differences between features.
Lanier.img (4-3-2) Swipe
Computers - ideal for manipulating and analyzing large continuous data sets displayed as grayscale. • Used to distinguish between slight spectral variations and enhance them.
Landsat 7 image with no contrast stretching - histogram for the near infrared band. Some features, like agricultural areas, can be distinguished.
Applying a histogram stretch produces a simple classification of urban, agricultural, and mixed use areas.
A. Contrast stretchingRadiometric resolution • Dynamic range or number of possible data values (Digital numbers) in each band of the image. • The range of DN’s is usually referred to by the number of bits into which the recorded energy is divided. • 28 = 256 is most common
0 = black 255 = white
A sensor measures the electromagnetic energy within its range. Total intensity of the energy from zero to the maximum is broken down into 256 brightness values for 8-bit data.
A. Contrast stretchingLinear grey-level stretching • Lower threshold value is chosen so that all pixel values below threshold are mapped to zero. • Upper threshold value is chosen so that all pixel values above threshold are mapped to 255. • All other pixel values are linearly interpolated to lie between 0 and 255. • Lower and upper thresholds are usually chosen to be values close to the minimum and maximum pixel values of the image.
Landsat TM image - Olympic Pennisula, NW Washington Vis red band
B. Spatial filtering • Changes contrast of image by applying filters. • Filters average small sets of cell values across the image to create new pixel values. • Filters are used to: • smooth an image • sharpen an image • detect edges in an image • Affects only the display of the image, not the underlying image data.
Spatial filtering encompasses another set of digital processing functions which are used to enhance the appearance of an image. Spatial filters are designed to highlight or suppress specific features in an image based on their spatial frequency. Spatial frequency is related to the concept of image texture
B. Spatial filtering By varying the calculation performed and the weightings of the individual pixels in the filter window, filters can be designed to enhance or suppress different types of features.
Spatial enhancement - highlights or suppresses features in an image based on its spatial frequency. • Zero spatial frequency - no variation in DN values of cells in the area, completely homogenous.
Low spatial frequency - small, gradual changes, difference in values of neighboring cells is small. Example – water
High spatial frequency-great changes in cell values, differences between adjacent cells can be large. Example - edges of urban infrastructure, roads, buildings and fragmented geologic structures.
Filters - used to change spatial frequency of images.Each one uses a kernel (a matrix of values) that is passed over the image like a moving window to average value of each cell with the values of surrounding cells. 3x3 kernel being applied to the cell, target cell always corresponds to center of kernel.
Smooth a continuous image • low-pass filter decreases spatial frequency. • Filter's 3 x 3 kernel is populated entirely with the value 1 which averages the image data values. • example, value of 28 in the target cell is reduced to 12 in output pixel.
Calculation used to average the data • Smoothing these images makes visual interpretation easier.
Sharpen an image • high-pass filter - enhance edges and boundaries of areas in an image. • increases spatial frequency. • assigns high weight to target cell and surrounding cells are given negative weights. • result - slight differences magnified.
Sharpen • Example - enhancing linear features • rivers, field boundaries, roads, boundaries of buildings. • Application • enhance images that are blurred due to atmospheric haze, rapid sensor motion.
Three main purposes for filters • improve interpretability of image data • aid in automated feature extraction • remove/reduce sensor degradation