Download
1 / 22
220 likes | 391 Views
Spectroscopy Experiment (NMR). Determination of the Identity of an unknown organic compound using selected physical properties, Infrared Spectroscopy, and NMR Spectroscopy Unknown List: pp. 126 – 127 in Slayden Lab Manual References Slayden, et al. – pp. 59 – 60

E N D
Spectroscopy Experiment (NMR) Determination of the Identity of an unknown organic compound using selected physical properties, Infrared Spectroscopy, and NMR Spectroscopy Unknown List: pp. 126 – 127 in Slayden Lab Manual References • Slayden, et al. – pp. 59 – 60 • Pavia, et al. – pp. 909 – 964 • Schornick –http://classweb.gmu.edu/jschorni/chem318
Spectroscopy Experiment (NMR) • Overview • Physical Properties • Boiling Point & Purification (Simple Distillation) • Physical Characteristics of Unknown • Refractive Index with Temperature Correction • Solubility (Relative to Water) • Density (Relative to Water) • Infrared Spectra Analysis • NMR Spectra Analysis
Spectroscopy Experiment (NMR) • The Laboratory Report: • Determination of an Unknown • Procedures • Title – Use Short, Concise terms Simple Distillation, Refractive Index, IR Spectrum, etc. • Materials & Equipment (2 Columns in list (bullet) form) Note: include all reagents & principal equipment used
Spectroscopy Experiment (NMR) • The lab Report (Cont’d) • Procedure Description: • Descriptions must be detailed, but concise • Use list (bullet) form • Use your own words (don’t copy book) • Results – Neat, logically designed template to present results • Summary of Results • Paragraph summarizing experimental results, computed results, and principal absorptions from the IR & NMR spectra. • Analysis & Conclusions • A logical step by step set of arguments, utilizing selected results, to support the proposed identity of the Unknown compound
Spectroscopy Experiment (NMR) • Organic Lab – Unknowns, Purification, Boiling Point • Several experiments in Chem 315/318 (Org Lab I & II) involve the identification of an unknown compound • Liquid samples that students receive in Lab may contain some impurities in addition to the unknown compound that could produce ambiguous results when determining the chemical or physical properties of the compound • Simple Distillation is used to purify the sample by separating the pure compound that comes over in a narrow temperature range – corresponding to its boiling point – from impurities that have boiling points either lower than or higher than the compound
Spectroscopy Experiment (NMR) • Vapor Pressure / Boiling Point • Boiling Point The normal boiling point (also called the atmospheric boiling point or the atmospheric pressure boiling point) of a liquid is the temperature at which the vapor pressure of the liquid is equal to 1 atmosphere (atm), the atmospheric pressure at sea level At that temperature, the vapor pressure of the liquid becomes sufficient to overcome atmospheric pressure and allow bubbles of vapor to form inside the bulk of the liquid. The standard boiling point is now (as of 1982) defined by IUPAC as the temperature at which boiling occurs under a pressure of 1 bar 1 bar = 105 Pascals = 0.98692 atmospheres = 14.5038 psi (pounds per square inch) = 29.53 in Hg (inches of mercury) = 750.06 mm
Spectroscopy Experiment (NMR) • Distillation / Boiling Point Measurement Note: The temperature range you obtain for your boiling point may be inaccurate for three (3) reasons 1. The atmospheric pressure in the lab may not be: 1 bar (0.98692 atm) 2. The thermometers used in the lab may not reflect the actual temperature 3. The thermal inefficiency of the glassware used for the boiling point determination may result in a lower than expected measured value by as much as 2 – 5oC You should take this potential temperature differential into account when you compare your measured results with the list of possible unknowns in lab manual tables
Spectroscopy Experiment (NMR) • Simple Distillation Setup Note: Equipment used in distillation is expensive. Use care to avoid breakage. ASK BEFORE YOU ACT!! Note: The distillation procedure description includes the equipment setup process and the steps taken to collect the data • Equipment • Heating Plate (from cabinet to right of entrance door) • Sand Bath to hold distillation flask • 25 mL Distillation Flask • Distillation Head • Thermometer & Thermometer Adapter
Spectroscopy Experiment (NMR) • Simple Distillation Setup (Con’t) • Condenser (with rubber tubing for cooling water) • Receiving containers • 50 mL beaker for low boiling point and high boiling point impurities. • 50 mL Erlenmeyer flask for purified sample • Procedure • Use Ring Stands to support apparatus Note: Adjust height of apparatus so that sample receiving containers (small beaker & small Erlenmeyer flask) can sit on bench about an inch below where the condensate emerges from the condenser
Spectroscopy Experiment (NMR) • Simple Distillation Setup (Con’t) • Procedure (Con’t) • Use tablets, books, etc., to adjust height of Heating Plate • Use blue clamp to attach distillation flask to distillation head • Use blue plastic clamp to secure condenser tube to distillation head • Tighten tongs of clamp supporting the condenser tube just enough to ensure condenser tube water-input/output ports point outward or slightly up • Insert thermometer through adapter so that bulb is positioned just below elbow opening to condenser
Spectroscopy Experiment (NMR) • Typical Distillation Setup (Simple Distillation)
Spectroscopy Experiment (NMR) • Simple Distillation - Data Collection • Set Hot Plate Heat control unit to 4-5 • Use 50 mL beaker to collect low boiling point impurities • Collect drops of condensate in waste beaker until temperature rise slows down and becomes constant Note: It may be necessary to increase the temperature setting on the controller • Collect purified sample condensate in 50 mL Erlenmeyer flask throughout the period when the temperature is relatively constant
Spectroscopy Experiment (NMR) • Simple Distillation - Data Collection • If the temperature begins to increase again, turn the heat off, remove the Erlenmeyer flask, and collect any remaining condensate in the waste beaker • Put the purified sample back into the original vial for further processing • Dispose of any waste organic liquid in the jar in the hood
Spectroscopy Experiment (NMR) • Solubility/Density (Relative to Water) • Add 2-3 mL Distilled water to a small to medium test tube • Add 4-5 drops of the purified distillate or 3 mg of solid sample to the test tube • Shake the test tube vigorously • Note the following: • Did the sample dissolve, i.e., single clear solution? • Determine relative density • Does the sample float on top of the liquid? • Does the sample float in the middle of the liquid or disperse throughout the liquid? • Does the solid settle to the bottom?
Spectroscopy Experiment (NMR) • Refractive Index Abbe Refractometer (Bausch & Lomb) • Clean prisms with tissues & methyl alcohol – BE GENTLE!! • Do not touch prism with fingers or other hard objects, use tissues • Use sufficient drops of sample to cover pridm surface • Close hinged prisms together - Gently • Use switch on left to turn on the light • Move hinged lamp up into position
Spectroscopy Experiment (NMR) • Refractive Index (Con’t) • Rotate coarse and fine adjustment knob on the right side of instrument until horizontal dividing line (may not be sharp at first) between the light (Top) and dark (Bottom) halves of the visual field coincide with the center of the cross-hairs • Use eyepiece to focus cross-hairs • If horizontal line dividing light & dark areas appears as a colored band (chromatic aberration), adjust with the knurled drum knob on the front of the instrument • Press switch on left side of instrument down to make the scale visible • Read Refractive Index value to 4 decimal places
Spectroscopy Experiment (NMR) Refractive Index - Reading the Instrument • Index of Refraction (ND) is the ratio of the speed of light in a vacuum (air) vs. the speed of light in a medium • The speed of light in a medium increases with decreasing density and decreases with increasing density • Thus, Nd increases with increasing temperature (lower density) and decreases with decreasing temperature (higher density) • Measured values of “nD” are adjusted to a standard 20oC. • Read the room temperature using the thermometer attached to the instrument or use the one in your set.Correction Factor = t * 0.00045 = (Rm Temp – 20) * 0.00045 (Con’t on next slide)
Spectroscopy Experiment (NMR) If temp > 20oC then t is positive - correction factor is added If temp < 20oC then t is negative - correction factor subtracted Ex: For an observed value of 1.5523 at 25oC, the correction is: Instrument is read to “4” decimal places The value corrected for temperature is: nD20 = nDrm temp + t (0.00045) t = Room Temp - 20.0oC nD20 = 1.5523 + (25 – 20)*(0.00045) = 1.5523 + 0.00225 = 1.5546 Note: nD at 25oC, as expected, is lower than nD at 20oC Typical Range of Values for Organic Liquids: 1.3400 - 1.5600 1.5500 1.5523 1.5550 1.5580 1.5600
Spectroscopy Experiment (NMR) • IR Spectrum • Salt Plate Preparation • Liquid Samples • 1 to 2 drops of liquid sample are placed between two single crystals of sodium chloride (Salt Plates) Note: NaCL plates are water soluble – do notuse water or methanol to clean plates • Solid Samples soluble in Acetone • Dissolve sample in acetone • Evaporate on Salt Plate • Solid Samples not soluble in acetone • Make Potassium Bromide (KBR) pellet
Spectroscopy Experiment (NMR) • IR Spectrum • Salt Plate Preparation (Con’t) • Plate Holder • Place Salt Plate sandwich into base of Plate Holder • Place Plate Holder top over base and press down • Obtain Spectrum • Instructor - At the start of session enter new “background” • Student - Insert Plate Holder into beam slot • Select Memory location (X, Y, or Z)
Spectroscopy Experiment (NMR) • IR Spectrum • Obtain Spectrum (Con’t) • Push “SCAN” button • Verify “No. of Scans” box shows “4” • Press “Execute” Note: If spectrum bottoms out - remove Cell Holder and reload Salt Plate with less sample; rerun Scan again
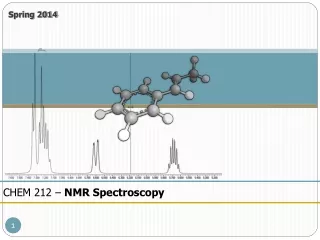
Spectroscopy Experiment (NMR) • When the “Scan” box in lower right corner indicates “Ready”, press “Plot” to produce chart • Remove Cell Holder • Clean & dry Salt Plates with Acetone • Place in desiccator, replace desiccator cap • An NMR Spectrum of your unknown will be handed out during the laboratory session. • Summarize the principal NMR peaks in the : • Results section of the report opposite the procedure description • The Results Summary Section • Analyze the NMR spectrum as part of the “Analysis & Conclusion” section